We Tracked 4.2 Million Bullion Prices. Here's What Was Actually Cheapest.
The State of Retail Bullion Premiums, first edition. June 2025 to August 2026.
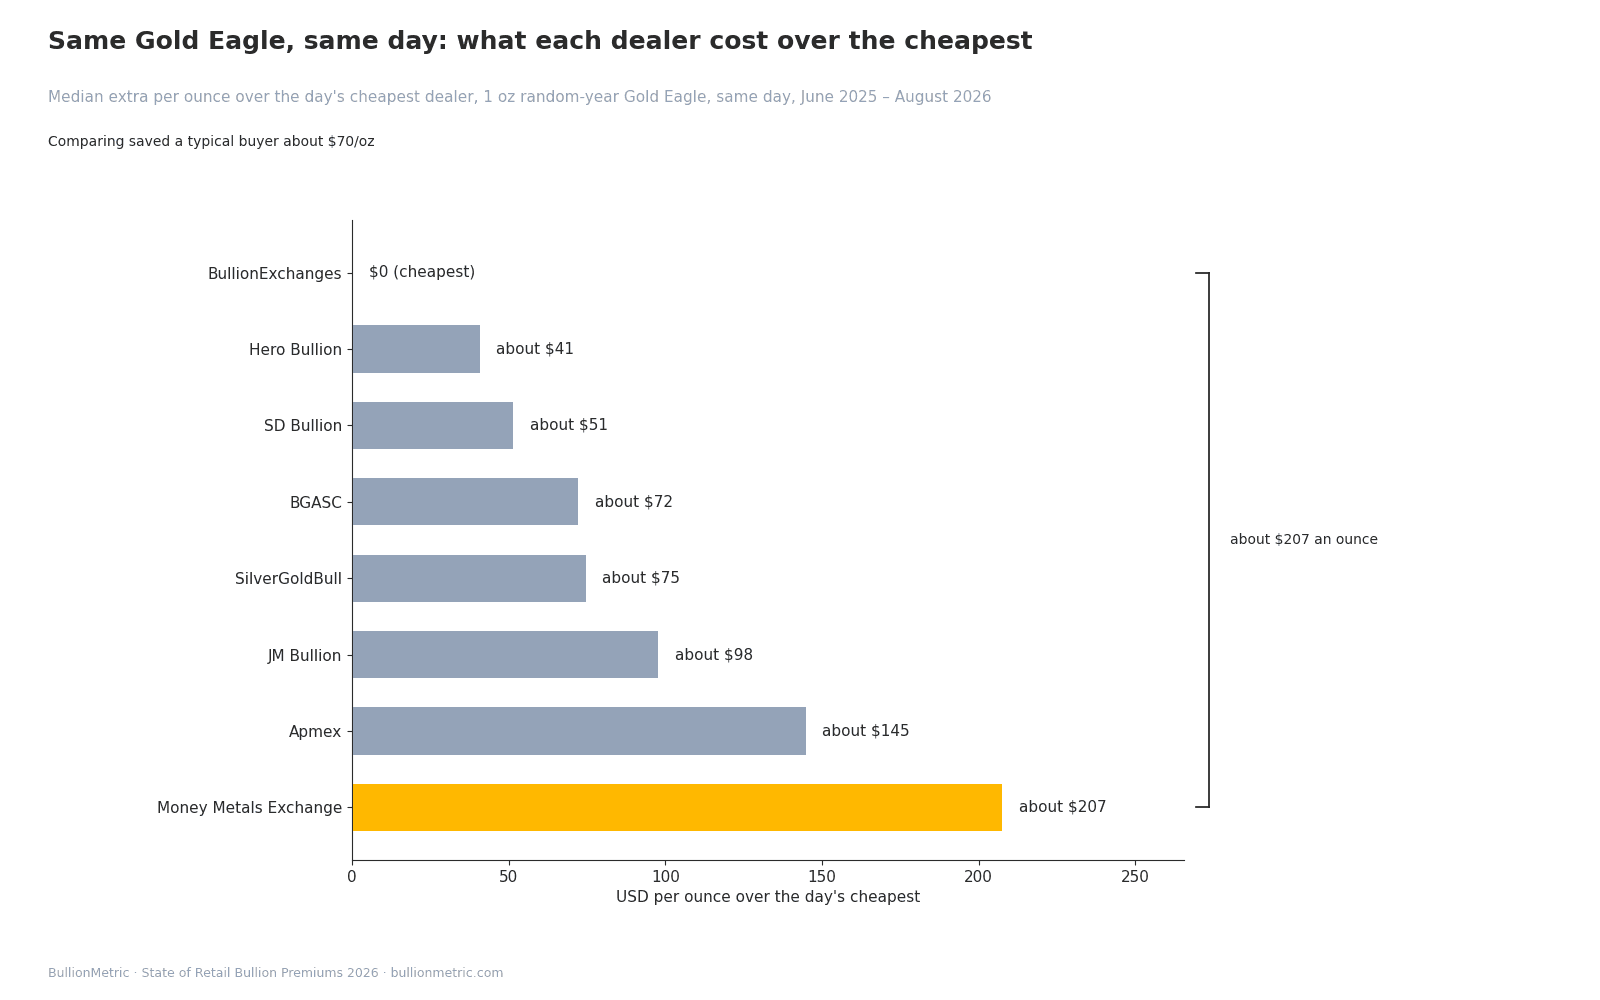
Same coin. Same day. $207 an ounce apart.
That's how much more a 1 oz Gold Eagle cost at Money Metals Exchange than at the cheapest dealer that day: the median across fifteen months. At Apmex, it was about $145.
You already know premiums vary. What's harder to see is how much, where, and on what. So we tracked every price from 11 online dealers for fifteen months, 4.2 million of them, and compared them like for like.
Some of what we found confirms what stackers already suspect. Some of it doesn't. Here's what it means for your next order.
Affiliate disclosure. As of October 5, 2026, BullionMetric has no affiliate or commercial relationship with any dealer in this report, and no dealer saw it before publication. If that changes, the findings won't. The full disclosure is in the dealer section of the evidence below.
10 Things 4.2 Million Prices Taught Us
1. Your dealer matters more than your coin. Same Gold Eagle, same day: Money Metals Exchange cost about $207 an ounce more than the cheapest dealer, and Apmex about $145. (Chapter 1)
2. Comparing pays about $70 an ounce on a Gold Eagle. It pays $40 on a Krugerrand and $2.37 on a Silver Eagle. That's the typical saving, not the best case. (Chapter 1)
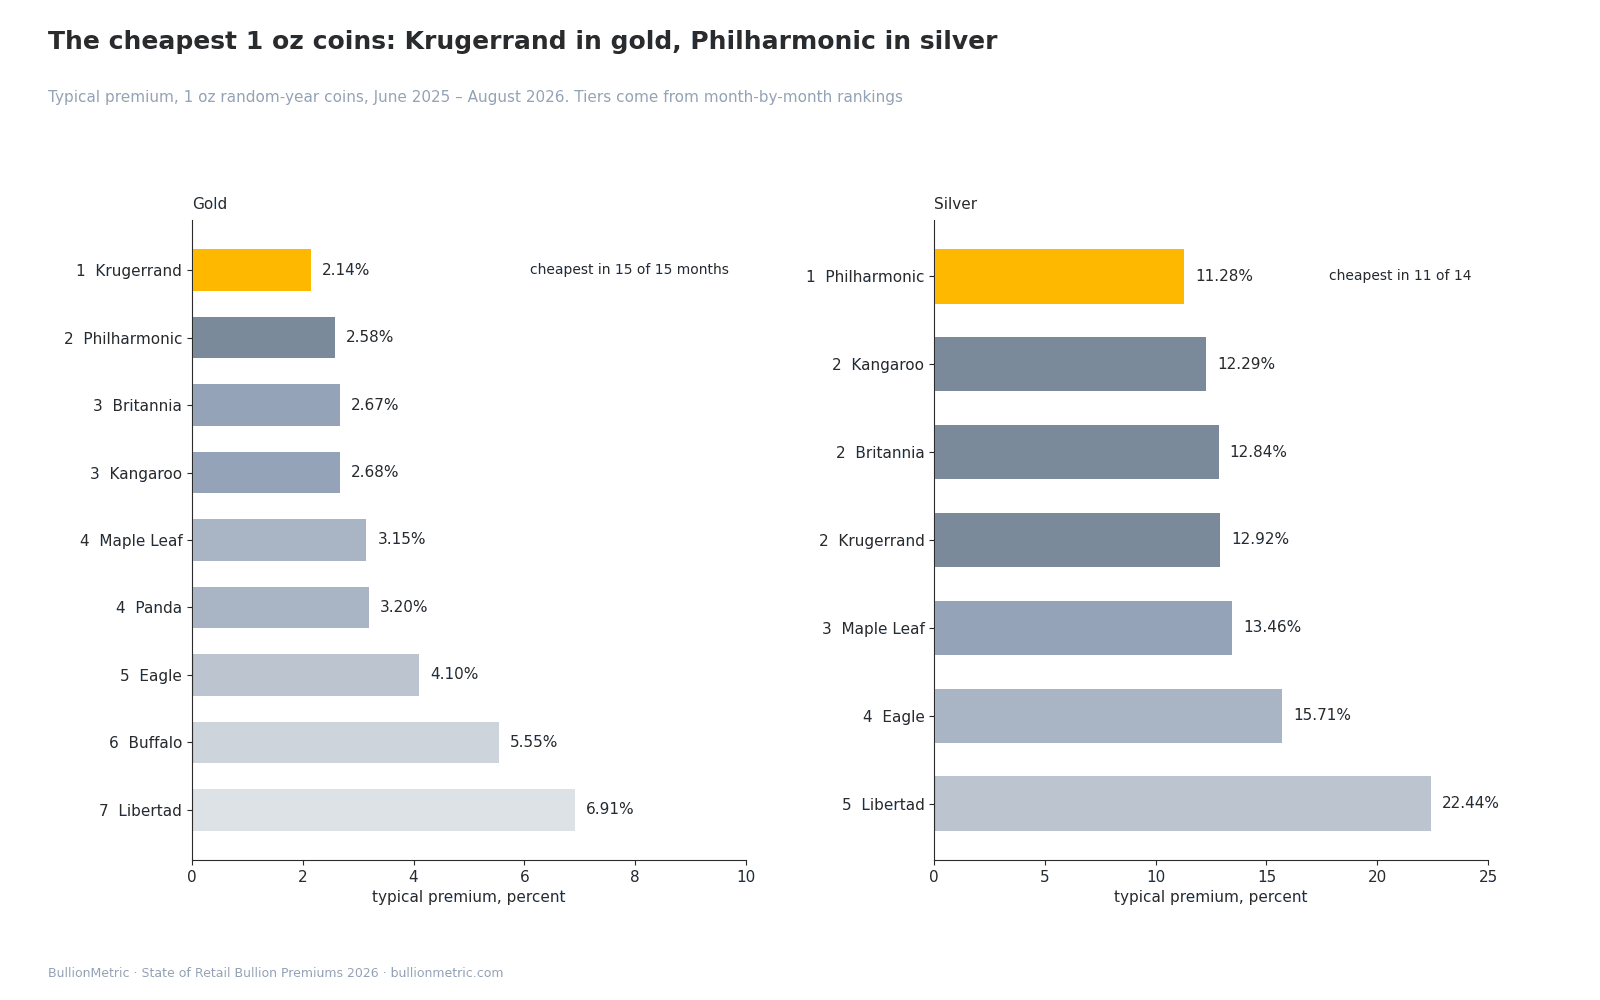
3. One gold coin was the cheapest in all 15 months. The random-year Krugerrand. (Chapter 2)
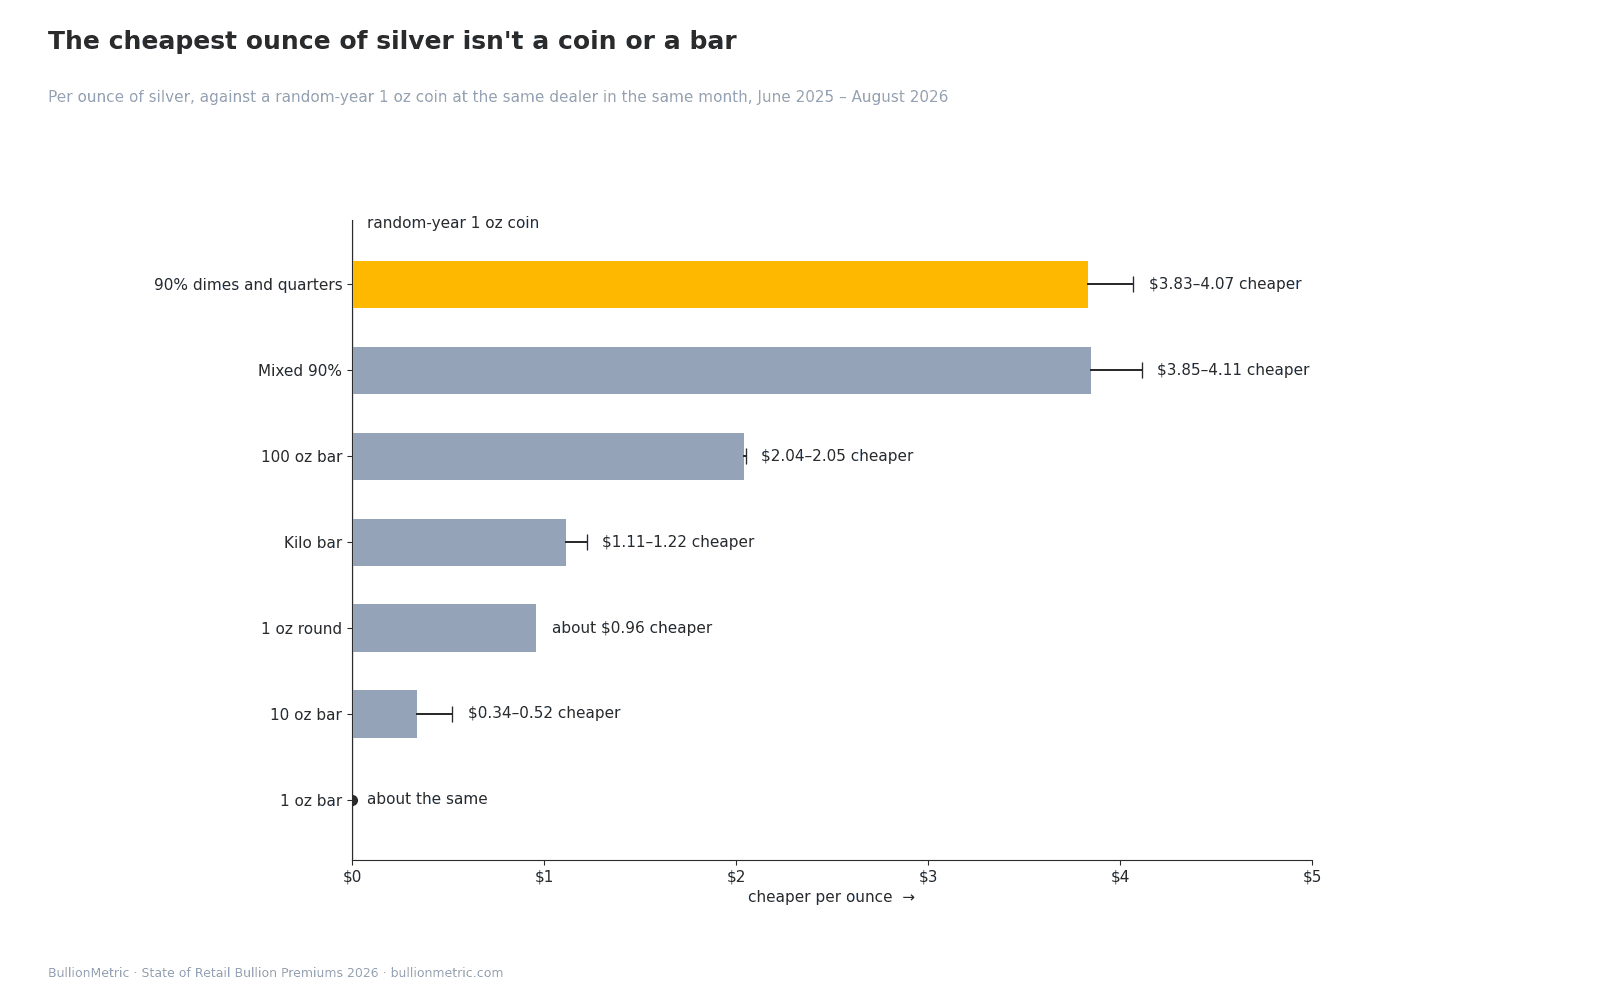
4. The cheapest ounce of silver wasn't a coin or a bar. Circulated 90% junk silver ran $3.83–4.07 an ounce below a random-year coin at the same dealer. (Chapter 3)
5. A generic round beat every silver coin. About $0.96 an ounce below a random-year coin. The cheapest coin was the Philharmonic, in 11 of 14 months. (Chapter 3)
6. Bigger silver bars cost less per ounce. A 100 oz bar saved about $2 an ounce over random-year coins. A 10 oz bar saved $0.34–0.52. (Chapter 3)
7. Dated always costs extra. On all 17 coins we measured, in every market. About $6.44 an ounce on a Silver Eagle. Buying the newest date doesn't get you out of it. (Chapter 2)
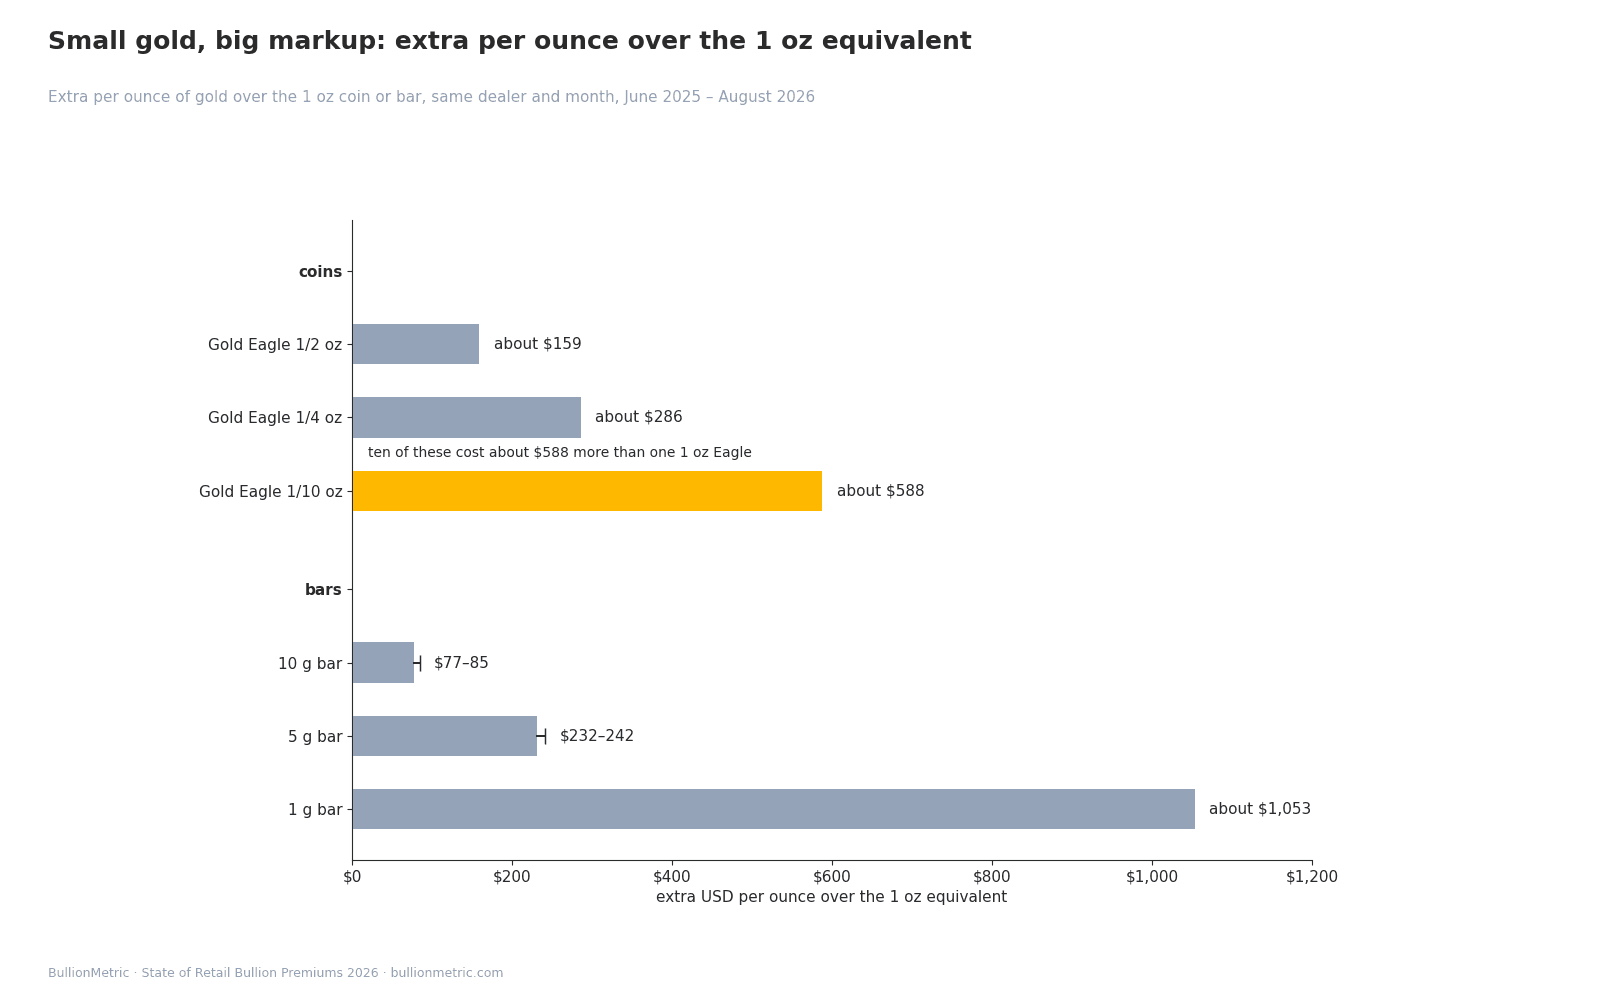
8. Small gold is expensive gold. Ten 1/10 oz Gold Eagles cost about $588 more in premium than one 1 oz Eagle. (Chapter 3)
9. The tube isn't a discount. Neither is any day of the week. (Chapter 4)
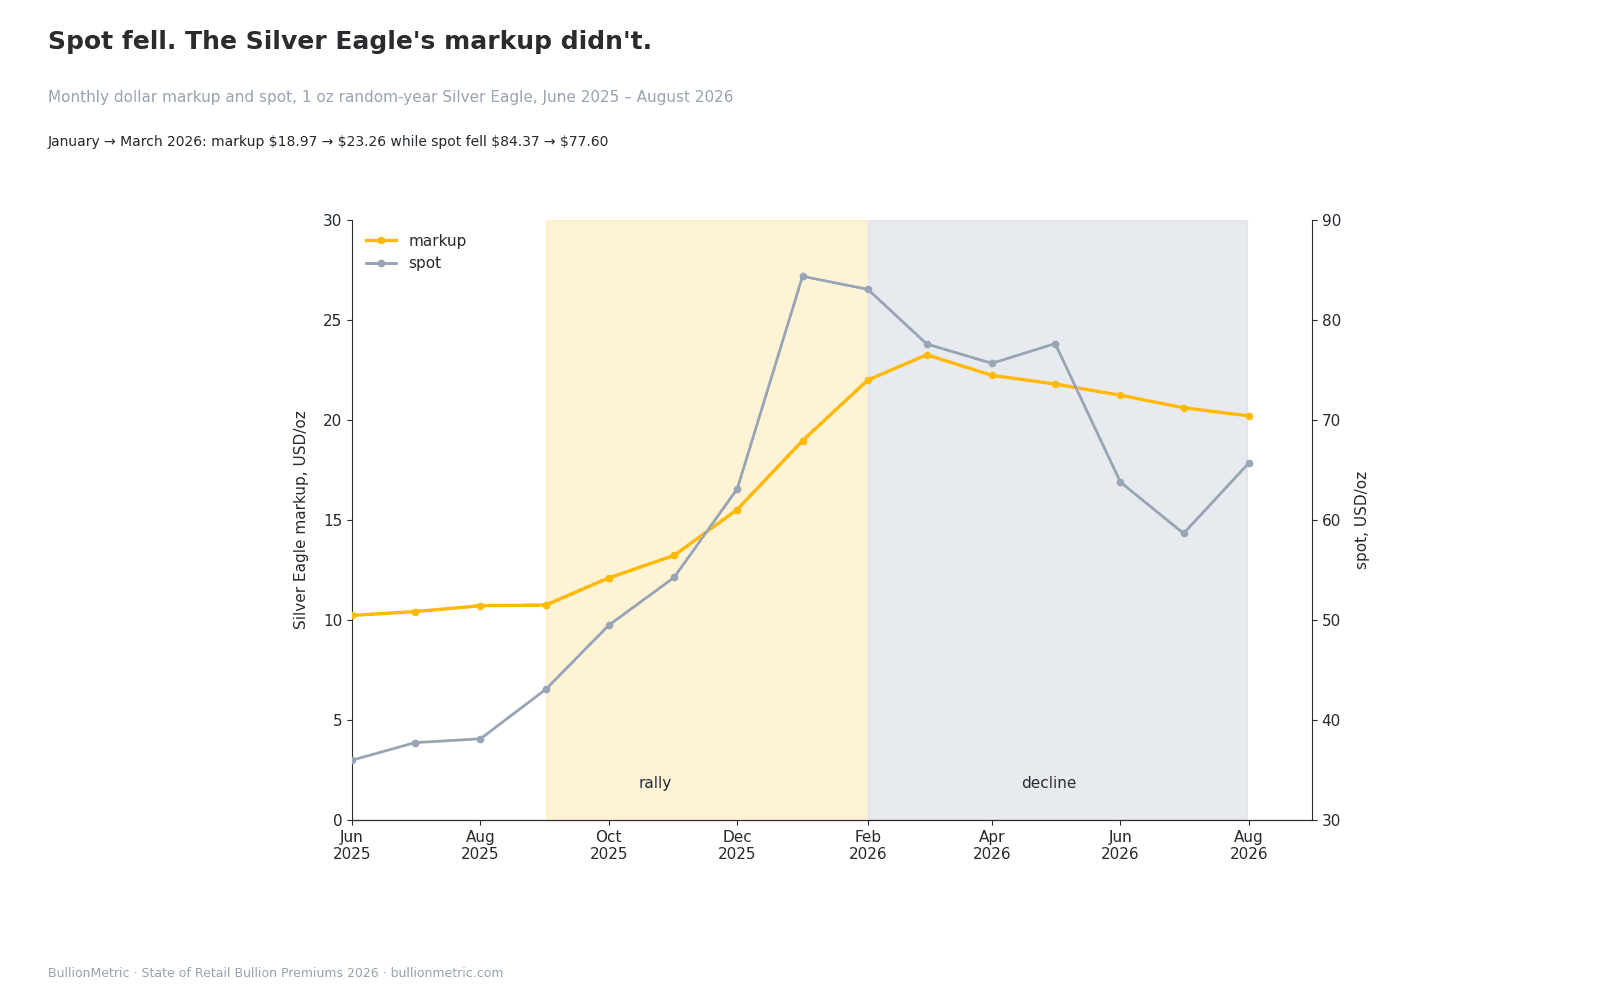
10. Waiting for the dip doesn't lower the premium. Dealers raised their markups as spot rallied and cut them by less as it fell. (Chapter 5)
How we measured. 4.2 million prices from 11 online dealers, June 2025 to August 2026. Every comparison is like for like: the same dealer in the same month, or different dealers on the same day at the same time of capture. Every price is the dealer's check/wire price for one unit.
What we can't tell you. Card prices and bulk-order discounts aren't in the data. Our product list was set in mid-2025, so 2026-dated coins aren't either. Where a reasonable method choice moved a number, we show a range instead of picking one. Every detail is in the evidence at the bottom of this page.
How to Save $70 an Ounce on a Gold Eagle Without Changing Coins
Most stackers pick a dealer once and stick with it. Here's what that costs.
We compared dealers the only fair way: the same random-year coin, on the same day, priced at the same time of day. Then we measured how far each dealer sat above the cheapest price available that day.
On the Gold Eagle, the spread was wide.
Gold Eagle (1 oz, random-year)
Median extra per ounce over the day's cheapest
BullionExchanges
$0
Hero Bullion
about $41
SD Bullion
about $51
BGASC
about $72
SilverGoldBull
about $75
JM Bullion
about $98
Apmex
about $145
Money Metals Exchange
about $207
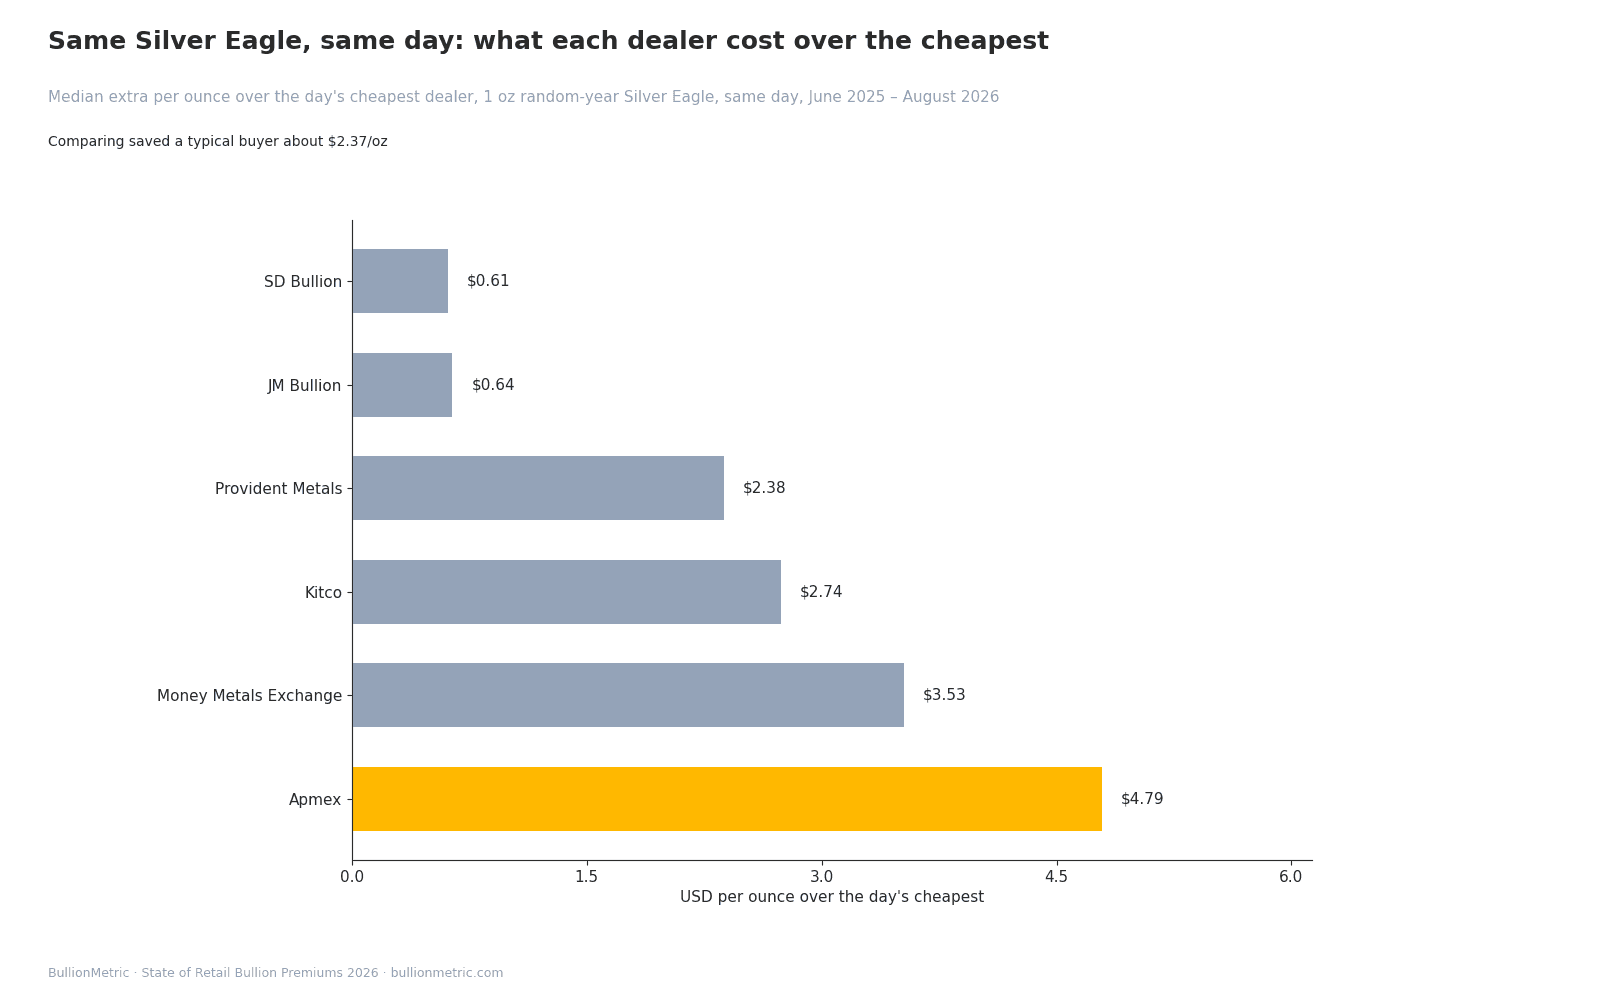
Silver Eagles show the same story, in smaller numbers.
Silver Eagle (1 oz, random-year)
Median extra per ounce over the day's cheapest
SD Bullion
$0.61
JM Bullion
$0.64
Provident Metals
$2.38
Kitco
$2.74
Money Metals Exchange
$3.53
Apmex
$4.79
Now the useful part. A buyer who compared dealers, instead of paying the middle dealer's price, saved about $70 an ounce on Gold Eagles, $40 on Krugerrands and $2.37 on Silver Eagles. That's the typical day, not the lucky one.
On a ten-coin Gold Eagle order, that's $70 × 10: about $700.
Premium vs markup, in 30 seconds. The premium is what you pay above spot, as a percentage of spot. The markup is the same gap in dollars. Percentages are best for comparing different products on the same day. Dollars per ounce are best for comparing dealers, because that's what leaves your account.
Who was cheapest
In gold, BullionExchanges. It was the cheapest dealer for six 1 oz gold coins, both before and after February 2026: the Gold Eagle, Krugerrand, Philharmonic, Maple Leaf, Buffalo and Kangaroo. Its median gap to the day's cheapest price was zero on all six.
The catch: it often didn't have them. BullionExchanges had the coin in stock on between a third and three-quarters of the days we compared: 72% for the Gold Eagle, down to 34% for the Kangaroo. Check it first. Have a second dealer ready.
Hero Bullion was the cheapest for the Gold Britannia, and SD Bullion for the Gold Panda, in both periods.
In silver, it depends on the coin. BGASC was the cheapest for the Silver Krugerrand and the Silver Philharmonic. SD Bullion led on the Silver Britannia. On the Silver Eagle, nobody held the top spot all year: JM Bullion led before February 2026, and SD Bullion after.
The pattern at the other end is consistent. Apmex was among the most expensive third of dealers on 7 of its 8 gold coins. Money Metals Exchange was among the most expensive third on all 7 of its gold coins, and on 4 of its 6 silver coins.
One dealer isn't ranked. Golden State Mint reported nearly every listing in stock, nearly every day, and we couldn't verify that. A dealer we call cheapest has to be one you can actually buy from.
Picking the right dealer is half of it. The other half is the coin itself, and one coin won every single month.
One Gold Coin Was the Cheapest in Every One of 15 Months
It wasn't close.
The random-year Krugerrand was the cheapest 1 oz gold coin in every month from June 2025 to August 2026, however the ranking was built. In silver, the Philharmonic was the cheapest 1 oz coin in 11 of 14 months.
Below the top, coins close in price trade places from month to month, so we group them in tiers.
Tier
Gold
Typical premium
Silver
Typical premium
1
Krugerrand
2.14%
Philharmonic
11.28%
2
Philharmonic
2.58%
Kangaroo, Krugerrand, Britannia
12.29–12.92%
3
Kangaroo, Britannia
2.67–2.68%
Maple Leaf
13.46%
4
Panda, Maple Leaf
3.15–3.20%
Eagle
15.71%
5
Eagle
4.10%
Libertad
22.44%
6
Buffalo
5.55%
7
Libertad
6.91%
Look where the Eagles sit. The Gold Eagle is in the fifth tier, the Silver Eagle in the fourth. The coin everyone knows isn't the cheap one.
The year on the coin costs extra
Random-year, dated, 2025-dated. A random-year coin is sold without a set year: the dealer picks which one ships. That flexibility is why it's usually the cheapest version. A dated coin is a specific year you choose. In this report, "dated" means 2024 or earlier, and "2025-dated" means the newest date we tracked.
A dated coin cost more than the random-year version on all 17 coins we measured, in all three phases of the market: the quiet summer of 2025, the rally and squeeze, and the 2026 decline.
In gold, the extra was modest: about $28 on a Krugerrand and about $60 on a Gold Eagle. In silver, it was heavy: about $6.44 an ounce on a Silver Eagle. And it depended a lot on the dealer, from 5.5 to 22.5 percentage points.
Buying the newest date didn't help. A 2025-dated Silver Eagle cost about $4.50 more than random-year (10.6 to 11.2 points), close to the 11.1 points for older dates. On a Gold Eagle, the 2025 date cost $56–62 more, against about $60 for older ones.
Some years are a different purchase altogether. Ordinary-date Silver Eagles from 2008–2020 cost about $3–6 more than random-year. The key dates, 1986, 1994, 1996 and 1997, cost 74 to 120 points more. Those are collector coins, priced as such.
The coin is one choice. Its form is another, and the cheapest ounce of silver we found wasn't a coin or a bar.
The Cheapest Ounce of Silver Isn't a Coin or a Bar
It's junk.
Circulated 90% silver dimes and quarters cost $3.83–4.07 less per ounce of silver than a random-year 1 oz silver coin at the same dealer, in the same month. That held in every phase of the market.
Here's every form of silver we could measure, against a random-year 1 oz coin at the same dealer:
Silver
Per ounce, against a random-year 1 oz coin
90% dimes and quarters
$3.83–4.07 cheaper
Mixed 90%
$3.85–4.11 cheaper
100 oz bar
$2.04–2.05 cheaper
Kilo bar
$1.11–1.22 cheaper
Generic 1 oz round
about $0.96 cheaper
10 oz bar
$0.34–0.52 cheaper
1 oz bar
about the same
Two takeaways if you're stacking for the metal. At one ounce, a generic round beats every coin, including the Philharmonic, by $0.61–0.63 an ounce. And the bigger the bar, the more you save, with the real savings starting at a kilo.
How junk silver is priced. Junk is priced on the silver it contains, not its face value. Dealers price circulated 90% coin at 0.715 oz of silver per $1 of face value, which allows for wear (new coins held about 0.723 oz). Silver dollars hold 0.7734 oz each. Our junk figures use those same contents.
Gold: buy the coin, not the 1 oz bar
In gold, the coin won. A new 1 oz gold bar cost $19–23 an ounce more than a random-year 1 oz coin at the same dealer, and $50–53 more than a Krugerrand. That held in every phase of the market.
Size helps, but only at the top. A kilo gold bar cost $33–45 less per ounce than a 1 oz bar. A 10 oz bar was about the same as a 1 oz.
These comparisons cover new-production bars. Secondhand bars, sold as "secondary market" or "varied condition", are a separate market, and few dealers list them, so we don't give a figure. At one ounce, most of the secondhand bars listed were vintage Engelhard and Johnson Matthey bars priced as collectibles. At 10 oz and up, secondhand bars ran somewhat cheaper than new bars at the same dealer, but on too few dealers for a firm number.
Small gold, big markup
The smaller the gold, the more each ounce costs.
Gold
Extra per ounce over the 1 oz equivalent
1/2 oz Gold Eagle
about $159 (+3.8 points)
1/4 oz Gold Eagle
about $286 (+6.8 points)
1/10 oz Gold Eagle
about $588 (+13.6 points)
10 g bar
$77–85 (+2.0 points)
5 g bar
$232–242 (+5.5 points)
1 g bar
about $1,053 (+26.1 to +27.1 points)
Put plainly: ten tenth-ounce Gold Eagles cost about $588 more in premium than one 1 oz Eagle. If you're buying fractional anyway, the half-ounce Panda was the cheapest half ounce in 12 of 15 months. (It weighs 15 g, a little under half an ounce; we priced it per actual ounce.)
That covers what to buy. Then there are the habits that feel like savings and aren't. The first one is sitting in a lot of safes.
6 Stacker Habits That Cost More Than They Save
"A tube is cheaper per coin." Not against random-year singles. A Silver Eagle tube cost $3.09 an ounce more, and a monster box $1.07–3.37 more. That's against the single-coin price, the most a dealer charges per coin. One fair exception: against the same dated coin bought one at a time, a tube was about $0.52 an ounce cheaper.
"Buy on a Tuesday." No weekday was reliably cheapest. The "cheapest day" changed depending on how we measured it, and the differences were tiny: under a third of a point in gold.
"Graded is a better buy." A graded Silver Eagle cost about $47–48 more than a random-year one, and a proof about $49–50 more. That's a collector purchase, not a stacking one.
"Buy the newest coin." A 2025-dated coin cost about as much extra as any other date.
"A 1 oz silver bar beats a coin." About the same. If you want the cheapest ounce at that size, buy a round.
"The price is the price." At Apmex and JM Bullion, the check/wire price is 4% below the card price. On most gold coins, that's more than the extra for a dated coin.
Why check/wire prices. Every price in this report is the dealer's check/wire price for one unit, the lowest payment price most dealers offer. Pay by card and you'll pay more. Buy in bulk and some dealers will charge less per coin.
One myth is bigger than the rest: that a falling spot price brings premiums down with it.
Why Waiting for the Dip Doesn't Lower Your Premium
Spot fell. Your premium didn't.
Here's what dealers did over fifteen months. In the rally, from September 2025 to January 2026, they raised their dollar markups in step with the metal. Gold markups passed through 78–112% of the rise, and silver coin markups 89–96%. The premium, as a percentage, held.
In the declines of 2026, they didn't cut as fast. Silver coin markups passed through only 27–49% of the fall. Gold's percentage premium rose however we measured it.
By the end, the dollar markup was higher in both metals: gold from $143.84 to $192.09, silver coins from $10.03 to $18.78.
Dollars or percent? A premium is a percentage of spot. If spot falls and the dealer's dollar markup stays put, the premium rises, even though nobody changed a price tag. That's why we track both.
Three moments show it most clearly:
October 2025: gold crossed $4,000. The Krugerrand stayed the cheapest gold coin through it.
January 2026: the silver squeeze. The Krugerrand and the Philharmonic led their metals through the squeeze.
Early 2026: the decline. From January to March, the Silver Eagle's markup rose from $18.97 to $23.26 while spot fell from $84.37 to $77.60. Buyers who waited out the spike paid more premium, not less.
So buy when you're ready, from the cheapest dealer that day. Timing the premium doesn't work.
Before Your Next Order: 8 Checks That Pay for Themselves
Buy random-year unless the year matters to you. (Chapter 2)
Start with the Krugerrand in gold and the Philharmonic in silver.(Chapter 2)
In silver, look at rounds, big bars and junk before coins. (Chapter 3)
Buy the largest size you'll actually use.(Chapter 3)
Compare dealers on the day, for the exact coin.(Chapter 1)
Pay by check or wire if you can. (Chapter 4)
Skip tubes, slabs and weekday timing as ways to save. (Chapter 4)
Don't wait for the dip to fix the premium.(Chapter 5)
Why should I trust a comparison site?
No dealer pays us or saw this report before publication. Every number traces to a claims register, and we publish unflattering results on the same terms as flattering ones. Check the evidence below.
That's not what I paid.
Probably not. These are check/wire prices for one unit. Card payment costs more, and large orders can cost less per coin.
Why isn't my dealer ranked on my coin?
A dealer needed 20 comparable days on a coin to be ranked on it. Golden State Mint isn't ranked at all, because we couldn't verify its stock status.
Where are the 2026 coins?
Not in this edition. Our product list was set in mid-2025. The next edition will include them.
Will this change when you take affiliate money?
No. The findings stay as published, and any relationship will be listed with the date it began.
The Evidence
Everything above comes from what follows. Every number traces to a claims register, and the method and its limits are written out in full. If you want to check our work, start here.
The buyer's guide in full
This section gives every finding from the article above in full, with its tables, ranges and caveats.
It answers the buyer's questions in order: which coin, which year, which size and form, and which dealer. The premium is what a buyer pays above spot, as a percentage. The markup is the same gap in dollars. For comparisons between sizes and forms, markups are stated per troy ounce of metal, so a tenth-ounce coin and a kilo bar can be set side by side.
Almost every comparison here is made within one dealer, in one month: the dealer's dated coin against the same dealer's random-year coin, or its 10 oz bar against its 1 oz bar, in the same month (see M.10). Prices move a lot over fifteen months, and two products are rarely in stock at the same times. Comparing across the whole window at once would mix the price of the metal into the comparison. The dealer section compares dealers on the same day, at the same hour of capture. Every price is the dealer's check/wire price for a single unit (see M.1).
Where a figure depends on a judgment call — how many listings a dealer-month needs, or which bars count as collectible — it is published as a range covering the reasonable choices. Where three or more dealers support a figure, it is a single estimate; where two do, it is a range; where fewer do, it is not measured.
III.1 — The cheapest coins: the Krugerrand in gold, the Philharmonic in silver
Short version. The random-year Krugerrand was the cheapest 1 oz gold coin in all fifteen months, and the Philharmonic the cheapest 1 oz silver coin in 11 of 14. Below the top, coins trade places, so they're grouped in tiers.
The random-year Krugerrand was the cheapest 1 oz gold coin in every one of the fifteen months, under every way of timing spot. It ranks first however the ranking is built: pooled over the window, month by month, or over the months when every coin was in stock. The month-by-month section found the same in every market window it ranked (see II.3 and II.5–II.8); this confirms it holds month by month across the whole period.
The Philharmonic was the cheapest 1 oz silver coin in 11 of 14 ranked months — 10 of 14 under one alternative timing of spot, 11 under the other. It also ranks first under every method.
Below the top, coins close in price swap places depending on how the ranking is built. They are grouped in tiers rather than numbered.
Tier
Gold
Typical premium
Silver
Typical premium
1
Krugerrand
2.14%
Philharmonic
11.28%
2
Philharmonic
2.58%
Kangaroo, Krugerrand, Britannia
12.29–12.92%
3
Kangaroo, Britannia
2.67–2.68%
Maple Leaf
13.46%
4
Panda, Maple Leaf
3.15–3.20%
Eagle
15.71%
5
Eagle
4.10%
Libertad
22.44%
6
Buffalo
5.55%
7
Libertad
6.91%
1 oz random-year coins. The typical premium is the median across all fifteen months, shown for scale; the tiers come from month-by-month rankings, not from these figures. Coins sharing a tier swap places between ranking methods. Libertads were in stock too rarely to rank month by month, and rank last by every method available. The Silver Panda is not ranked: one dealer held 63% of its listings.
The Silver Eagle, the most widely held silver coin, sits in the fourth silver tier. Every widely stocked silver coin except the Libertad and the Panda cost less.
For buyers: in gold, start with the random-year Krugerrand. In silver, start with the Philharmonic. If you prefer another coin, the tier shows what the preference costs.
III.2 — A date costs extra on every coin, in every market
Short version. A dated coin cost more than the random-year version on all 17 coins, in every phase of the market: modestly in gold, heavily in silver. A 2025-dated coin cost about as much extra as an older date.
A dated coin cost more than the random-year version of the same coin in all 17 coin programs measured, and that held in all three phases of the market — the quiet summer of 2025, the rally and silver squeeze, and the 2026 decline. It is the most consistent finding in this report.
The date tax is how much more a dealer charges for a coin of a specific earlier year than for the same coin, random-year, in the same month. The published figure is the median across dealers (see M.10). Dollars lead, because they are what a buyer pays. "Dated" here means coins dated 2024 or earlier; 2025-dated coins are covered below.
Gold: a modest extra
Coin
Date tax
Points
Krugerrand
+$28.08
+0.64
Kangaroo
+$28.11
+0.66
Philharmonic
+$32–34
+0.80
Maple Leaf
+$44.71
+1.01
Britannia
+$45.04
+1.32
Buffalo
+$56.39
+1.33
Eagle
+$60.35
+1.50
Panda
+$101
+2.3
Libertad
+$264–294
+7.6 to +8.8
1 oz coins, June 2025 – August 2026, same dealer and same month on both sides, three or more dealers each. Ranges cover the two sample-size thresholds tested. The Panda's level moves with the timing of spot. On the Britannia and the Libertad, one dealer supplies more than half the dealer-months; the median counts each dealer once.
Silver: a larger extra
Coin
Date tax
Points
Philharmonic
+$0.60–0.67
+1.7
Britannia
+$3.39–4.06
+6.4 to +8.7
Maple Leaf
+$4.78
+10.1
Eagle
+$6.44
+11.1
Panda
+$9.51–10.52
+26.4 to +27.1
Kangaroo
$2.01–5.08 (+3.1 to +9.0 pp)
two dealers, range only
Krugerrand
$5.01–6.11 (+11.1 to +12.5 pp)
two dealers, range only
Same basis as the gold table. On the Panda, one dealer supplies more than half the dealer-months. Libertads are not given a figure: dated Libertads carry large premiums that depend on the dealer and on scarce back dates, and the estimate is not stable.
On the Silver Eagle, where you buy matters as much as whether you buy dated. Across dealers, the date tax ran from 5.5 to 22.5 percentage points.
How this relates to II.2. II.2 measured the date tax in the quiet summer of 2025 alone (see II.2). This section covers all fifteen months. The two answer different questions — what a date cost in a calm market, and what it cost across a full year of them — and both stand. The Silver Eagle's date tax was +$3.66 in the quiet summer and +$6.44 across the full window.
A 2025-dated coin is not a way around the date tax
A coin dated 2025 cost about as much extra over random-year as an older date. For a buyer, choosing the most recent issue did not avoid the date tax.
Coin
2025-dated vs random-year
Dated 2024 or earlier vs random-year
Silver Eagle
about $4.50 (+10.6 to +11.2 pp)
+$6.44 (+11.1 pp)
Gold Eagle
+$56–62 (+1.5 pp)
+$60.35 (+1.5 pp)
Krugerrand
about $23.50 (+0.55 pp)
+$28.08 (+0.64 pp)
Other coins, 2025-dated against random-year: Gold Britannia +$17.70–20.73 (+0.64 pp); Buffalo +$30.91–37.30 (+0.89 to +1.11); Kangaroo +$16.76–17.92 (+0.52); Maple Leaf about $13.90 (+0.31); Gold Philharmonic about $30.33 (+0.83); Silver Britannia +$0.76–1.04 (+1.85 to +2.61); Silver Maple Leaf +$1.67–1.95 (+3.8).
The window runs through August 2026, so the 2025-dated figures include 2026 months, when a 2025 coin was the previous year's issue. Coins dated 2026 were not tracked (see M.1).
For buyers: if the year does not matter to you, buy random-year. On gold the extra for a date is modest; on silver it is large, and it varies widely by dealer.
III.3 — Most "Silver Eagle" listings are not the cheapest Silver Eagle
Short version. Random-year coins were only 1–2% of Silver Eagle listings in every month. Most of what you see under "Silver Eagle" is graded, proof or dated.
Random-year Silver Eagles made up only 1–2% of Silver Eagle listings in every month. Most of what a buyer sees under "Silver Eagle" is something else.
What the listing is
Share of Silver Eagle listings, by month
Graded, proof or burnished
46–54%
Dated 2024 or earlier
33–43%
Dated 2025
4–11%
Random-year
1–2%
Shares of listing observations across the fifteen months. They measure what dealers list, not what buyers purchase.
The dated and 2025-dated shares each moved by more than five points over the window. An average taken over "all Silver Eagle listings" can therefore rise or fall without any dealer changing a price. That is why this report measures bullion coins by segment, never as one blended average.
For buyers: the cheapest Silver Eagle is the random-year listing, and it is the one you are least likely to land on first.
III.4 — Graded and proof coins are collector purchases
Short version. A graded Silver Eagle cost about $47–48 more than a random-year one, and a proof about $49–50 more. In gold, the extra was a few points.
A graded 1 oz Silver Eagle cost about $47–48 more than a random-year one at the same dealer in the same month. A proof cost about $49–50 more. In percentage terms that is roughly 75 to 84 points on a coin whose random-year premium is in the teens.
The dollar figure is stable however it is measured. The percentage moves with the price of silver in the months each coin was in stock, so the dollars lead (see M.10).
In gold, the extra is a few points:
Coin
Graded vs random-year
Proof vs random-year
Buffalo
+$67–74 (+1.7 pp)
+$138 (+3.2 pp)
Eagle
+$95–99 (+2.6 pp)
+$193 (+4.2 pp)
Panda
+$139 (+4.2 pp)
—
Same dealer and month on both sides, three or more dealers. Other coins had too few dealers selling both versions in the same months to measure.
For buyers: on silver, a slab or a proof finish costs several times the random-year coin's entire premium. That can be worth paying for a collection. It is not a way to accumulate metal.
III.5 — Which year: ordinary dates cost a little, key dates a lot
Short version. Ordinary 2008–2020 Silver Eagles cost about 5–10 points more than random-year. The key dates, 1986, 1994, 1996 and 1997, cost 74 to 120 points more.
On the Silver Eagle, an ordinary date from 2008–2020 cost about 5 to 10 points more than random-year — roughly $3 to $6 a coin. The key dates cost 74 to 120 points more.
Silver Eagle date
Extra over random-year
2008–2020
+5.0 to +10.4 pp (about $3–6)
2022
+9.5 pp (about $5.80)
2023
+5.9 to +6.4 pp (about $3.50)
2024
+6.9 to +7.7 pp (about $4.80)
2025
+10.6 to +11.2 pp (about $4.50)
1987–2006
+8 to +32 pp, depending on the year
1986
+97 to +99 pp (about $45)
1994
+74 to +79 pp
1996
+105 to +120 pp (about $59)
1997
+84 to +86 pp
Same dealer and month, date against random-year. Ranges cover the two sample-size thresholds tested. 2021 cost +10.3 pp. The US Mint replaced the coin's original reverse design partway through 2021, so coins of both designs carry that date. The 2025 row includes months in 2026, when it was the previous year's issue. 2007 had two dealers only and is not listed.
For buyers: if the date doesn't matter, don't pay for one. If it does, check the year: 1986, 1994, 1996 and 1997 are collector purchases, priced as such.
III.6 — Smaller gold costs more per ounce
Short version. Smaller gold costs more per ounce: ten 1/10 oz Gold Eagles cost about $588 more in premium than one 1 oz Eagle, and a 1 g bar about $1,053 more per ounce than a 1 oz bar.
The smaller the gold coin, the more you pay for each ounce of gold in it. Buying an ounce of gold as ten 1/10 oz Gold Eagles cost about $588 more in premium than buying one 1 oz Eagle.
Each size is compared with the 1 oz coin of the same program, at the same dealer in the same month, random-year against random-year.
Size
Gold Eagle
Gold Maple Leaf
1/2 oz
+3.8 pp (about $159 per oz)
see note
1/4 oz
+6.8 pp (about $286 per oz)
+9.2 pp ($369–380 per oz)
1/10 oz
+13.6 pp (about $588 per oz)
+12.6 to +15.7 pp ($518–688 per oz)
Premium over the 1 oz coin, per troy ounce of gold. Three or more dealers in every cell. Ranges cover the two sample-size thresholds tested. The 1/2 oz Maple Leaf is effectively a single listing sold by six dealers whose prices for it differed widely; its figure (+11.8 to +12.0 pp) reflects that disagreement more than its size, and it is not compared with the other cells.
The direction held in every market phase measured; the size of the premium varied. Fractional silver could not be measured: too few dealers sold random-year fractional and 1 oz silver in the same months.
The cheapest fractional gold coin
At 1/2 oz, the Gold Panda was the cheapest random-year coin in 12 of 15 months. The Panda's "half ounce" is 15 grams, 0.482 oz; premiums are per actual ounce of gold, so the comparison is fair.
At 1/10 oz, the Philharmonic was among the cheapest. It ranked first on average but was the cheapest in only 6 of 15 months.
At 1/4 oz, no coin led clearly. The ranking methods disagree.
Gram bars
A 1 g gold bar cost about $1,053 more per ounce of gold than a 1 oz bar at the same dealer. The extra falls steeply with size.
Bar
Premium over the 1 oz bar
1 g
+26.1 to +27.1 pp (about $1,053 per oz)
5 g
+5.5 pp ($232–242 per oz)
10 g
+2.0 pp ($77–85 per oz)
Same dealer and month, eight to ten dealers. The gram bars and the 1 oz bars are not always the same brand: Valcambi and Argor-Heraeus lead the gram-bar listings, while the brand of 36% of 1 oz bar listings could not be identified.
For buyers: fractional gold and gram bars are a convenience, and you pay for it by the ounce. Buy the largest size your budget allows. At a half ounce, the Panda was the cheapest coin.
III.7 — Coins, rounds or bars
Short version. In gold, a random-year 1 oz coin was cheaper than a new 1 oz bar. In silver, a generic round was the cheapest 1 oz form, and bigger bars cost less per ounce.
At one ounce
In gold, a random-year 1 oz coin was cheaper than a new 1 oz bar at the same dealer. A 1 oz gold bar cost $19–23 more per ounce than a random-year coin (+0.47 to +0.55 pp), and $50–53 more than a Krugerrand (+1.14 to +1.19 pp). Ten dealers; the result held in all three market phases. Gold rounds could not be measured.
In silver, a generic 1 oz round was the cheapest 1 oz form.
Silver, 1 oz
Difference
Round against a random-year coin
about $0.96 per oz cheaper (−1.8 pp)
Round against the Philharmonic
$0.61–0.63 per oz cheaper (−1.5 pp)
Bar against a round
$2.20–2.35 per oz dearer (+4.2 to +4.3 pp)
Bar against a random-year coin
about the same: within $0.30–0.43 per oz, and the direction reversed during the rally
Bar against the Philharmonic
$1.09–1.90 per oz dearer
Same dealer and month. The round result rests on six dealers and held in all three market phases. The 1 oz bar against the coin changed sign during the rally, so neither is called cheaper.
Bigger bars
In silver, the larger the bar, the lower the premium per ounce.
Silver bar
Against a 1 oz bar
Against a random-year 1 oz coin
5 oz
$0.46–0.98 per oz cheaper
—
10 oz
$0.83–1.42 per oz cheaper
$0.34–0.52 per oz cheaper
Kilo
$1.50–2.29 per oz cheaper
$1.11–1.22 per oz cheaper
100 oz
$2.09–2.82 per oz cheaper
$2.04–2.05 per oz cheaper
Same dealer and month, six to eight dealers. The 10 oz and kilo results held in all three market phases.
In gold, a kilo bar cost $33–45 less per ounce than a 1 oz bar (−0.83 to −1.09 pp, four dealers). A 10 oz gold bar was about the same as a 1 oz bar: the direction reversed in one phase.
These comparisons cover new-production bars. Secondhand bars, sold as "secondary market" or "varied condition", are a separate market, and few dealers list them, so we don't give a figure. At one ounce, most of the secondhand bars listed were vintage Engelhard and Johnson Matthey bars priced as collectibles. At 10 oz and up, secondhand bars ran somewhat cheaper than new bars at the same dealer, but on too few dealers for a firm number.
Why the bar figures are ranges. Some bars are sold as collectibles — art designs, themed series, vintage pours — and carry premiums that have nothing to do with the metal. The filter used to set them aside also caught many ordinary bars. Every bar figure is therefore shown both with and without it; each range covers both. The direction of every bar finding is the same either way (see M.10).
For buyers: for 1 oz of gold, buy a random-year coin, ideally a Krugerrand, rather than a bar. For silver, a generic round is the cheapest ounce; for larger amounts, a 100 oz bar saves about $2 an ounce over random-year coins, while a 10 oz bar saves well under a dollar.
III.8 — Junk silver was the cheapest silver per ounce
Short version. Circulated 90% silver cost $3.83–4.07 less per ounce of silver than a random-year 1 oz coin, cheaper than any coin or bar measured.
Circulated 90% silver dimes and quarters cost about $3.83–4.07 less per ounce of silver than a random-year 1 oz silver coin at the same dealer, in the same month (−7.0 to −7.1 pp, four dealers). Mixed 90% silver cost $3.85–4.11 less per ounce (−9.4 pp, three dealers). The direction held in all three market phases.
That is cheaper per ounce than any silver bar or coin in this report: a 100 oz bar saved about $2.05 per ounce against the same random-year coin.
90% halves were also cheaper than a random-year coin at both dealers that sold both.
Circulated Morgan and Peace dollars cost more per ounce of silver than a random-year coin at both dealers measured.
Lot sizes, 40% halves and war nickels could not be measured: too few dealers.
Premiums are measured on silver content, not on the coins' face value or gross weight: 0.715 oz per $1 of face value for circulated 90% coin, the figure dealers price it on, against about 0.723 oz when the coins were struck; and 0.7734 oz per silver dollar. Graded, proof, uncirculated and key-date dollars are excluded.
For buyers: per ounce of silver, junk 90% was the cheapest way to buy. It comes in small, recognisable units. Circulated silver dollars are priced as coins, not as metal.
III.9 — Which dealer
Short version. BullionExchanges was the cheapest dealer for six 1 oz gold coins when it had them in stock; Apmex and Money Metals Exchange were among the most expensive on most gold coins. Comparing saved a typical buyer about $70 an ounce on Gold Eagles.
Affiliate relationships. As of October 5, 2026, BullionMetric has no affiliate or commercial relationship with any dealer named in this report, and no dealer has seen or commented on these findings. BullionMetric intends to join dealer affiliate programs; the site is built to support affiliate links. When it does, this report's findings will not change. Any relationships will be listed here with the date each began, and future editions will apply the same fixed method to every dealer, whether or not it pays us.
The comparison uses the one product that is genuinely the same at every dealer: the 1 oz random-year coin of each program. Dealers are compared on the same day, and only with dealers whose prices were captured in the same part of that day(see M.3). A day counts when at least three dealers had the coin in stock. A dealer needs 20 such days on a coin to be ranked on it. The comparison is run separately for June 2025 – January 2026 and for February – August 2026, when nearly every dealer was captured overnight. A dealer "leads" a coin only if it leads in both periods, unless stated otherwise.
Golden State Mint is not included. Its listings were reported in stock on 99.9% of observations, against 33.7% for the typical dealer, and showed an out-of-stock listing on only 0.6% of days, against 99.4%. We could not verify that. A dealer shown as the cheapest has to be one a buyer can actually buy from. Money Metals Exchange's prices enter the daily data from February 12, 2026, and it has more missing delivery days than any other dealer (see M.1).
Gold
BullionExchanges was the cheapest dealer for six 1 oz gold coins, before and after February 2026: the Gold Eagle, Krugerrand, Philharmonic, Maple Leaf, Buffalo and Kangaroo. Over the full window it was the cheapest on about 80–85% of comparable days for the Eagle, Krugerrand, Philharmonic, Maple Leaf and Buffalo, and on most comparable days in each period. Its median gap to the day's cheapest price was zero on all six.
It was cheapest when it had stock, and it often didn't. BullionExchanges had the coin in stock on between a third and three-quarters of the comparable days: 72% for the Gold Eagle, 61% for the Maple Leaf, 51% for the Krugerrand, 49% for the Buffalo, 37% for the Philharmonic and 34% for the Kangaroo.
Hero Bullion was cheapest for the Gold Britannia, and SD Bullion for the Gold Panda, in both periods. No dealer had enough data to lead the Gold Libertad after February 2026.
Silver
BGASC was the cheapest dealer for the Silver Krugerrand and the Silver Philharmonic in both periods. SD Bullion was cheapest for the Silver Britannia in both.
No single dealer led on the Silver Eagle. JM Bullion was most often cheapest before February 2026, and SD Bullion after. The Silver Maple Leaf also changed hands, from Hero Bullion to SD Bullion. Provident Metals led the Silver Kangaroo in 2026, when there was enough data to rank it. No dealer had enough data to rank on the Silver Libertad or the Silver Panda.
What staying with one dealer cost
Over fifteen months, buying a Gold Eagle from Money Metals Exchange cost a median of about $207 per ounce more than the day's cheapest dealer, and from Apmex about $145.
Gold Eagle
Median gap to the day's cheapest
Days compared
BullionExchanges
$0
254
Hero Bullion
$40.78
310
SD Bullion
$51.43
338
BGASC
$72.13
306
SilverGoldBull
$74.61
128
JM Bullion
$97.76
249
Apmex
$144.77
168
Money Metals Exchange
$207.44
172
Silver Eagle
Median gap to the day's cheapest
Days compared
SD Bullion
$0.61
228
JM Bullion
$0.64
156
Provident Metals
$2.38
246
Kitco
$2.74
181
Money Metals Exchange
$3.53
120
Apmex
$4.79
105
Per troy ounce, 1 oz random-year coins, June 2025 – August 2026, same day and same capture period, Golden State Mint excluded. Each dealer's median is over the days it was compared. In percentage terms JM Bullion ranks just ahead of SD Bullion on the Silver Eagle; in dollars, SD Bullion is just ahead.
What comparing saves
A buyer who compared dealers, instead of paying the median dealer's price, saved about $2.37 per ounce on random-year Silver Eagles, about $70 per ounce on Gold Eagles and about $40 per ounce on Krugerrands. This is the typical gap between the middle dealer and the cheapest on the same day, not the widest spread, so it is a saving a buyer could reasonably expect.
Patterns across coins
In gold, BullionExchanges led every coin it had enough data to rank — six of six.
Apmex was among the most expensive third of dealers on 7 of its 8 gold coins, and last or second-to-last on 7 of 8. Money Metals Exchange was among the most expensive third on all 7 of its gold coins, and last or second-to-last on 6. JM Bullion was among the most expensive third on most of its gold coins.
In silver, Money Metals Exchange was among the most expensive third on 4 of its 6 coins. BGASC led both silver coins it had enough data to rank.
For buyers: compare dealers on the day, for the exact coin. In gold, check BullionExchanges first, and have a second choice ready for when it is sold out. On the Silver Eagle, JM Bullion and SD Bullion were the usual cheapest. The largest dealers were not the cheapest.
III.10 — Traps and myths
Short version. Tubes and monster boxes weren't cheaper than random-year singles, and no weekday was reliably cheapest. Paying by card costs more than check/wire.
A tube or monster box is not a discount
A tube or monster box of silver coins was not cheaper than random-year singles.
Pack
Against random-year singles
Silver Eagle tube
$3.09 per oz dearer (+6.5 to +8.2 pp)
Silver Eagle monster box
$1.07–3.37 per oz dearer (+3.1 to +5.6 pp)
Silver Eagle sealed box
$3.52–6.17 per oz dearer (+6.1 to +8.4 pp)
Silver Maple Leaf tube
$0.86–1.54 per oz dearer (+2.2 to +3.6 pp)
Silver Maple Leaf box
about the same (−$0.04 to +$0.48 per oz)
Same dealer and month. The Silver Eagle comparisons rest on three dealers.
This holds even for large buyers. The singles are priced at the one-coin price, the highest per-coin price a dealer charges; buying singles in quantity is cheaper still.
Packs were cheaper than buying the same dated coin one at a time: a Silver Eagle tube by $0.52 per oz and a box by $1.26 per oz, against singles dated 2024 or earlier, and a Silver Maple Leaf box by $1.19 per oz against 2025-dated singles. That compares a pack with the one-coin price of the same dated coin; volume pricing on singles, which this report does not observe, may close the gap.
There is no cheapest day of the week
No weekday was reliably cheapest. Which day came out cheapest changed with how spot was timed and how the comparison was made: for the Silver Eagle series it was Friday, Tuesday, Monday or Wednesday depending on the method (see M.3). The differences were small in any case — under a third of a point in gold, about half a point on the Silver Eagle series, and at most 1.2 points across silver coins, less under the other timings.
Other traps
A 2025-dated coin is not a discount on the date tax(see III.2).
A 1 oz silver bar is not cheaper than a coin(see III.7).
The price you see may not be the price you pay. Every price in this report is the dealer's check/wire price for a single unit. Paying by card usually costs more: at Apmex and JM Bullion, for example, the check/wire price is 4% below the card price. On most gold coins that is more than the extra for a dated coin (see III.2).
For buyers: don't pay for packaging you don't need, don't wait for a particular weekday, and check the payment method before comparing prices.
Month by month: June 2025 through August 2026
Dealer markups follow spot up and lag it down. In the rally, markups rose in step with the metal and percentage premiums held. In the declines, markups fell by less than the metal, so percentage premiums rose — in gold, in silver, and on the Silver Eagle alone.
Three terms carry this section. Spot is the reference price of the metal. The premium is what a buyer pays above spot, as a percentage. The markup is the same gap in dollars; it covers the dealer's costs as well as any profit. Use the percentage to compare products at the same moment, or to compare metals. Use dollars to follow one coin through time. Cross-metal comparisons below are per dollar of metal, not per ounce.
The sections that follow track this pattern through each market event of the fifteen months. Each answers three buyer questions: which coin, which dealer, and what a pullback in spot does and does not make cheaper.
II.1 — Markups kept pace with the rally and lagged the declines, June 2025 – August 2026
Dealers raised dollar markups on 1 oz bullion in step with the metal during the rally, and cut them by less than the metal during the declines. Percentage premiums therefore held on the way up and rose on the way down. Over the full fifteen months, the dollar markup rose in both metals.
The series cover 1 oz coins from the major bullion programs, excluding Kookaburra, Australian Lunar, Koala, gold Lunar and British Lunar issues. Gold includes bars; silver is coins only.
The rally, September 2025 – January 2026: markups kept pace
Dealers priced in step with the metal on the way up. Markup pass-through was 78–112% for gold and 89–96% for silver coins. Neither metal's percentage premium moved by more than the threshold this report treats as a real change: 0.15 percentage points for gold, 0.50 for silver. A buyer during the rally paid more in dollars, but the premium's share of the price stayed put.
The declines, February–July and April–July 2026: markups lagged
Markups fell by less than the metal, so the premium became a larger share of the price. Silver coin markups passed through only 27–49% of the fall, depending on the window and how the change is measured. The remainder showed up as a higher percentage premium. Gold's basket premium rose however the declines were measured. The Silver Eagle shows the same lag on its own (see II.9), so the result does not depend on which silver coins happened to be in stock.
The random-year Krugerrand, the cheapest coin in every ranking window that follows, tracked spot down more fully than the gold basket. A gold buyer in a falling market got more of the drop passed on with the Krugerrand than with the basket as a whole.
Why markups lag. One likely reason is that part of every markup covers handling, shipping and order costs that do not fall when spot does. A second plausible reason is that dealers reprice cautiously after a drop, waiting to see whether it holds. Both are interpretations; the price record shows the lag, not its cause.
The full fifteen months: dollars rose in both metals
The dollar markup ended higher in both metals, under every way of timing spot tested. The gold markup went from $143.84 to $192.09, up $48.25. The silver coin markup went from $10.03 to $18.78, up $8.75.
Silver coin premiums rose 1.6–4.4 percentage points, however the ends of the window are measured. Gold's premium sits between flat and slightly higher, depending on the ends chosen and on how spot is timed (see M.3). June 2025 against August 2026 gives +0.06 percentage points, inside gold's 0.15-point threshold. The first three months averaged against the last three give +0.46, outside it.
Gold, by month
Month
Spot
Premium
Markup
Observations
2025-06
$3,351.51
4.28%
$143.84 †
7,415
2025-07
$3,343.06
4.32%
$144.50
17,149
2025-08
$3,368.27
4.35%
$145.96
16,106
2025-09
$3,659.56
4.28%
$155.82
9,006
2025-10
$4,020.55
4.34%
$174.90
7,103
2025-11
$4,159.54
4.46%
$185.04
2,038
2025-12
$4,300.18
4.51%
$195.40
6,914
2026-01
$4,660.14
4.27% †
$196.96
6,896
2026-02
$5,030.24
4.36%
$219.30
6,502
2026-03
$4,840.67
5.21% ‡
$249.88 ‡
9,176
2026-04
$4,719.23
4.52%
$213.12
9,209
2026-05
$4,584.20
4.46%
$204.23
12,557
2026-06
$4,171.89
5.04%
$212.12
7,003
2026-07
$4,072.78
4.95%
$201.68
10,863
2026-08
$4,430.17
4.34%
$192.09
7,354
† Minimum of that column. ‡ Maximum of that column. Premium: 2026-01 / 2026-03. Markup: 2025-06 / 2026-03.
1 oz coins from the major bullion programs, plus bars. June 2025–August 2026. Gold observations run from 2,038 (November 2025) to 17,149 (July 2025).
Silver coins, by month
Month
Spot
Premium
Markup
Observations
2025-06
$35.98
27.64%
$10.03
5,805
2025-07
$37.73
26.41%
$9.90
13,094
2025-08
$38.12
25.65%
$9.79 †
13,423
2025-09
$43.07
23.51%
$10.07
8,193
2025-10
$49.48
23.42%
$11.44
8,684
2025-11
$54.04
23.21%
$12.58
1,712
2025-12
$63.23
22.38% †
$14.17
5,100
2026-01
$85.95
23.16%
$19.10
3,528
2026-02
$82.77
25.73%
$21.36
4,366
2026-03
$77.65
28.61%
$22.34 ‡
7,212
2026-04
$75.72
27.87%
$20.89
6,126
2026-05
$77.60
26.64%
$20.51
7,442
2026-06
$63.87
31.19%
$20.10
4,292
2026-07
$58.67
32.44% ‡
$19.02
4,886
2026-08
$65.67
29.28%
$18.78
5,326
† Minimum of that column. ‡ Maximum of that column. Premium: 2025-12 / 2026-07. Markup: 2025-08 / 2026-03.
1 oz coins from the major bullion programs, coins only. June 2025–August 2026. Silver coin observations run from 1,712 (November 2025) to 13,423 (August 2025). The Silver Eagle's share of this series moves between 53.20% and 64.86%.
Both metals set their percentage highs inside the declines: gold at 5.21% in March 2026, and silver coins at 32.44% in July 2026. The lows were 4.27% for gold in January 2026 and 22.38% for silver coins in December 2025.
The broader silver series, which adds rounds and bars to the coins, was 22.81% in June 2025 and 25.16% in August 2026. The coin share within it moved by 15.51 percentage points, so it serves as context; the coins-only series carries the finding.
What this means for buyers
A dip in spot is not a discount on the premium. When spot falls, the metal gets cheaper faster than the premium does. After a pullback, the premium is a larger share of the price.
Compare in dollars. Judge the premium, and compare dealers, in dollars (see III.9).
In gold, start with the random-year Krugerrand. It was the cheapest coin in every ranked window in this section.
II.2 — Choosing a year costs extra, and in silver the dealer matters more than the average (July – September 2025)
Before any of the volatility that follows, a buyer who wanted a specific year paid extra for it. For mainstream gold coins the extra was modest and consistent. For silver it was larger, and on several coins the choice of dealer mattered more than the average.
A random-year coin is one the dealer sells without a specific year. A dated coin, here, is a specific earlier year (a back-dated coin), not a graded, proof or damaged piece. The date tax is how much more the same dealer charges for the dated coin than for the random-year coin. It is measured for every dealer with at least 10 listings on each side; the published figure is the median of those dealers. Three or more paired dealers support a single estimate, reported with the range across dealers; two support a range only. Dollars lead, because they are what the buyer pays. Percentage points — the gap between the two percentages — let coins be compared with each other.
The window is 1 July through 30 September 2025, taken as a whole, and contains none of the excluded feed days. Privy and special editions are left out of both sides, since a variant is not a choice of year.
Gold: a modest extra, consistent on three coins
A dated Krugerrand, Britannia or Philharmonic cost a modest extra, and paired dealers agreed closely on it. A dated Krugerrand cost +$37.77, or +1.07 percentage points, with four dealers in a narrow band of +0.76 to +1.17. A dated Britannia cost +$38.15 (+1.18, three dealers) and a dated Philharmonic +$34.90 (+1.01, four dealers). None of these three dealer ranges is wider than the tax itself, so the median is a fair guide.
Coin
Random-year
Dated
Date tax
Date tax (pp)
Paired dealers
Dealer range (pp)
Tier
Krugerrand
2.08%
3.50%
+$37.77
+1.07
4
0.76–1.17
3+
Britannia
2.48%
3.71%
+$38.15
+1.18
3
0.98–1.39
3+
Philharmonic
2.53%
3.77%
+$34.90
+1.01
4
0.77–1.27
3+
Maple Leaf
2.88%
4.29%
+$48.88
+1.44
6
0.00–2.60
3+, dealer range wider than the tax
Eagle
3.31%
5.22%
+$65.30
+1.91
7
0.66–3.88
3+, dealer range wider than the tax
Panda
3.47%
7.27%
+$121.86
+3.53
5
1.14–4.61
3+
Buffalo
4.25%
6.02%
+$51.17
+1.49
6
0.00–2.57
3+, dealer range wider than the tax
Libertad
7.05%
15.66%
+$257.91
+7.73
3
7.34–11.40
3+
Quiet summer, July–September 2025, 1 oz coins from the major bullion programs. The tax, the range and the tier are within-dealer. Random-year and dated columns are the pooled premiums the date tax compares. Coins ordered by random-year premium, lowest first.
On the Maple Leaf, the Buffalo and the Eagle, the dealer range is wider than the tax. A dated Gold Maple Leaf has a median of +$48.88 (+1.44 percentage points) across six dealers, but those dealers run from 0.00 to 2.60. On these coins, where you buy matters more than the average (see III.9).
Silver: a larger extra, and the range is the finding
Silver date taxes run on a different scale, and two coins cannot support a single estimate.
Coin
Random-year
Dated
Date tax
Date tax (pp)
Paired dealers
Dealer range (pp)
Tier
Philharmonic
10.71%
14.53%
+$0.75
+1.89
4
0.78–1.96
3+
Kangaroo
11.33%
15.84%
—
—
2
1.31–12.40
range only
Maple Leaf
11.49%
24.42%
+$5.08
+12.42
4
8.23–15.69
3+
Britannia
12.15%
24.58%
+$3.46
+7.17
4
3.73–15.05
3+, dealer range wider than the tax
Eagle
14.19%
26.60%
+$3.66
+9.86
5
5.51–26.56
3+, dealer range wider than the tax
Libertad
19.62%
59.83%
—
—
2
10.52–31.86
range only
Panda
23.14%
53.10%
+$8.96
+24.89
3
19.67–50.62
3+, dealer range wider than the tax
Same window and split as the gold table. Coins ordered by random-year premium, lowest first. Kangaroo and Libertad are range only: two paired dealers do not support a point estimate. Libertad's dollar gap is $3.99 to $11.76. Kangaroo's is $0.32 to $4.99: one of its two dealers charges 32 cents more for a dated coin, the other charges $4.99. That is why a two-dealer median describes neither.
Where a silver coin has a middle estimate, the dealer range is often the real result. The Silver Eagle runs 5.51–26.56 percentage points across five dealers. The Britannia runs 3.73–15.05, wider than its +7.17 tax. The Maple Leaf is tighter: its four dealers (8.23–15.69) sit around a +12.42 median. A shopper who uses the average and ignores the dealer is using the wrong number.
Dealer by dealer
Every paired dealer is listed.
The Gold Maple Leaf:
Dealer
Date tax (pp)
Date tax
Apmex
+0.61
+$20.71
BGASC
+1.51
+$48.54
JM Bullion
+2.15
+$76.14
Provident Metals
+1.38
+$49.23
SD Bullion
+2.60
+$84.76
SilverGoldBull
+0.00
+$1.22
Gold Maple Leaf, quiet summer, within-dealer, paired at 10 or more listings on each side. Six paired dealers. The percentage and dollar columns are separate medians, so they need not convert exactly: SilverGoldBull's +0.00 points and +$1.22 are both correct.
The Silver Eagle:
Dealer
Date tax (pp)
Date tax
Apmex
+15.20
+$5.87
Golden State Mint
+26.56
+$10.24
JM Bullion
+5.58
+$2.36
Provident Metals
+5.51
+$2.11
SD Bullion
+9.86
+$3.66
1 oz Silver Eagles in bullion condition, of any date, quiet summer, within-dealer. Five paired dealers. The median of the five falls on SD Bullion's figure.
The Silver Maple Leaf:
Dealer
Date tax (pp)
Date tax
Apmex
+15.69
+$6.01
JM Bullion
+14.36
+$5.90
Provident Metals
+8.23
+$4.05
SD Bullion
+10.47
+$4.25
Silver Maple Leaf, quiet summer, within-dealer. Four paired dealers.
What this means for buyers
If the year does not matter, buy random-year. Every coin in both tables cost more dated than random-year.
In gold, check the dealer on the Maple Leaf, Buffalo and Eagle. The Krugerrand, Britannia and Philharmonic carry a predictable extra.
In silver, compare the dated price dealer by dealer. A dated Silver Eagle cost +$2.11 more at Provident Metals and +$10.24 more at Golden State Mint.
II.3 — As gold crossed $4,000, the cheapest coin stayed the cheapest (6–31 October 2025)
As gold broke $4,000, the random-year Krugerrand was the cheapest of the four gold coins on 14–15 of 23 days. The move in the metal did not change the leader. The Philharmonic and the Britannia took the remaining days.
The window runs 6 through 31 October 2025 and compares the random-year 1 oz Krugerrand, Philharmonic, Britannia and Maple Leaf. One day did not have three of the four listed, which leaves 23 ranked days. The Krugerrand's count depends on how spot is timed (see M.3); it leads under every timing.
Coin
Premium across the window
Markup across the window
Krugerrand
2.42%
$98.04
Philharmonic
2.59%
$103.31
Britannia
2.77%
$111.06
Maple Leaf
3.15%
$127.23
Random-year 1 oz gold, 6–31 October 2025, median across the window.
The gap between the cheapest and dearest coin is real money at checkout. On percentage, the ranking metric, the Krugerrand's 2.42% compares with 3.15% for the Maple Leaf. On the same ounce of gold, that is a $98.04 markup against $127.23.
For buyers: with gold at $4,000, the cheapest 1 oz coin was still the random-year Krugerrand.
II.4 — Monthly premiums showed no response to the critical minerals designation (November 6, 2025)
Premiums in November, the month of the designation, stayed inside the range this report treats as no real change. Gold's percentage premium moved +0.12 percentage points from October, and silver coins' moved −0.21, both inside their thresholds.
On November 6, 2025, the U.S. Geological Survey released its final 2025 List of Critical Minerals, adding silver and nine other minerals. Gold is not on the list, so the designation applied to one of the two metals in this report.
November 2025 is also the thinnest month in the data: 2,038 gold observations and 1,712 silver-coin observations, fewer than any other month of the fifteen. A day-by-day reaction to the November 6 announcement therefore cannot be separated from the rest of the month.
Month
Gold spot
Gold premium
Gold markup
Gold obs
Silver spot
Silver coin premium
Silver coin markup
Silver obs
2025-10
$4,020.55
4.34%
$174.90
7,103
$49.48
23.42%
$11.44
8,684
2025-11
$4,159.54
4.46%
$185.04
2,038
$54.04
23.21%
$12.58
1,712
2025-12
$4,300.18
4.51%
$195.40
6,914
$63.23
22.38%
$14.17
5,100
1 oz coins from the major bullion programs (gold includes bars; silver is coins only), October–December 2025. Three months only.
Gold stayed inside its threshold at every step. Its percentage premium went from 4.34% to 4.46% to 4.51%: +0.12 percentage points into November and +0.05 into December, both inside the 0.15-point gold threshold. The dollar markup rose from $174.90 in October to $195.40 in December as spot rose from $4,020.55 to $4,300.18. That is the same dollars-with-the-metal pattern as the rally in II.1.
Silver coins stayed inside theirs. The premium went from 23.42% in October to 23.21% in November, −0.21 percentage points, inside the 0.50-point silver threshold. December's 22.38% is the lowest silver-coin percentage of the fifteen months, and it sits inside the rally already described in II.1.
For buyers: the designation did not change what a 1 oz coin cost above spot — in silver, the metal it named, or in gold.
II.5 — In the weeks after the rate cut, the Krugerrand stayed cheapest (December 18, 2025 – January 14, 2026)
The random-year Krugerrand was the cheapest of the four gold coins on 23–24 of 24 days in the weeks after the December rate cut and through the holidays. Every day in the window could be ranked, and the Krugerrand loses at most one day when spot is timed differently (see M.3).
The Federal Reserve cut its target rate by a quarter point, to 3.50–3.75%, on December 10, 2025 — its third cut of the year. This window opens eight days later, so it describes the weeks that followed the cut rather than the reaction to it.
The window runs 18 December 2025 through 14 January 2026, with the same four random-year 1 oz gold coins. A day counts when at least three of the four are listed.
Coin
Premium across the window
Markup across the window
Krugerrand
1.68%
$75.42
Philharmonic
1.95%
$85.84
Britannia
2.13%
$95.87
Maple Leaf
2.86%
$128.42
Random-year 1 oz gold, 18 December 2025–14 January 2026, median across the window.
This window holds the lowest Krugerrand level in the report. The Krugerrand's premium across the window was 1.68%, or $75.42 a coin, against 2.42% in October, 2.26% in the silver squeeze and 2.32% in the February–March selloff. It is a level for this window, set beside the others.
The data does not pin down a single day on which dealers repriced. Holiday listings are thin and a one-day median moves with the timing of spot, so the result that holds is the ranking.
For buyers: through this window the random-year Krugerrand carried a $75.42 markup, against $128.42 for the Maple Leaf, on the same ounce of gold.
II.6 — Through the silver squeeze, the Krugerrand and the Philharmonic led their metals (January 10 – February 20, 2026)
The squeeze did not move the gold ranking, and in silver the Philharmonic led on most days. In gold, the random-year Krugerrand was the cheapest of four coins on 31–33 of 37 days, and all four gold premiums stayed in a tight band between 2.26% and 2.96%. In silver, premiums ran several times higher per dollar of metal, and the Philharmonic was the cheapest widely stocked 1 oz coin on 23–25 of 28 days.
Silver reached a record near $121 an ounce on January 29, 2026, then fell roughly 30% the next day — its worst session since 1980. The drop was widely attributed to the nomination of Kevin Warsh as Federal Reserve chair and to higher futures margin requirements. This window spans the run-up, the crash and the weeks after.
The window runs 10 January through 20 February 2026 and compares random-year 1 oz bullion in each metal; gold and silver are not the same trade. Gold's four coins are the Krugerrand, Philharmonic, Britannia and Maple Leaf. Silver's ranked coins are the Philharmonic, Maple Leaf and Britannia. The Silver Kangaroo is reported beside them but not ranked, for the reason given below.
Gold: the order held
The Krugerrand led on 31–33 of 37 ranked days — 33 under one timing of spot and 31 under the other two (see M.3). It is the leader under all three, and the Philharmonic and the Britannia took the remaining days. All four gold levels hold within gold's 0.15-point threshold under the other timings, so they are published as point figures.
Coin
Premium across the window
Markup across the window
Krugerrand
2.26%
$111.44
Philharmonic
2.63%
$128.11
Britannia
2.78%
$138.59
Maple Leaf
2.96%
$143.84
Random-year 1 oz gold, 10 January–20 February 2026, median across the window.
This is the same order as in the quiet summer and in October: Krugerrand cheapest, Maple Leaf dearest, Philharmonic and Britannia in between. On the same ounce of gold, the checkout gap was a $111.44 Krugerrand markup against $143.84 for the Maple Leaf.
Silver: the Philharmonic led
The Philharmonic was cheapest on 23–25 of 28 days — 25 under one timing of spot and 23 under the other two (see M.3). It is the leader under all three. The Maple Leaf and the Britannia took the remaining days, and neither came close to the Philharmonic's level across the window. These silver levels move by more than half a percentage point with the timing of spot, so they are published to one decimal (see M.3). The cheapest coin does not change.
Coin
Premium across the window
Markup across the window
Philharmonic
10.6%
$8.74
Britannia
13.4%
$11.54
Maple Leaf
13.4%
$11.04
Random-year 1 oz silver, Philharmonic, Britannia and Maple Leaf, 10 January–20 February 2026, median across the window. One decimal because the level is sensitive to how spot is timed.
The Britannia and the Maple Leaf tie for second on percentage. Both sit at 13.4% to one decimal; unrounded, they are 13.38% and 13.40%, so this report names no winner between them. Their dollars differ, $11.54 against $11.04 on the same ounce of silver, but percentage remains the ranking metric.
The Kangaroo: priced, not ranked
The Silver Kangaroo's level across the window was 12.4% and $10.45, on the same one-decimal basis and with the same spot-timing caveat. It stays out of the ranking because it does not measure a market: one dealer supplied the great majority of listings in this window, and most days had fewer than two dealers. A one-dealer price can be a true price, but it cannot be a ranking. Its placement also moves with the clock — second of the four silver coins on one timing of spot, third behind the Maple Leaf on another.
Per dollar of metal
Per $1,000 of metal, the cheapest silver coin carried several times the premium of the cheapest gold coin. Percentage is the cross-metal metric, because an ounce of gold and an ounce of silver are not the same purchase. Applied to $1,000 of spot, the Krugerrand's 2.26% is about $23 of premium, and the Philharmonic's 10.6% is about $106. That is a level comparison for this window, not a view on which metal to hold.
For buyers: through the squeeze, the cheapest coin in each metal stayed the cheapest — the random-year Krugerrand in gold, the Philharmonic among widely stocked silver coins. What the silver premium did after the spike, on the coin most U.S. buyers actually purchase, is in II.9 (see II.9).
II.7 — Gold sold off and the Krugerrand still led on 31 of 34 days (February 24 – March 31, 2026)
Gold spot fell about 11–13% across this window, and the random-year Krugerrand remained the cheapest of the four gold coins on 31 of 34 days. The count is the same under every timing of spot. What changed was the premium: as a share of a falling spot, it ended higher than it started.
By the World Gold Council's measure, gold fell 12% in March 2026, its weakest month since June 2013. This window starts a week before March and ends with it.
The window runs 24 February through 31 March 2026, and all 34 days could be ranked. Spot moved −11.19% from the first ranked day to the last, and −12.52% using three-day ends.
The ranking held; only the dearer coins' levels moved with the clock. The Krugerrand's level, 2.32% and $114.58, holds within gold's 0.15-point threshold under every timing. The other three move by more than 0.15 percentage points when spot is timed differently (see M.3), but the order of the four does not change.
Coin
Premium across the window
Markup across the window
Krugerrand
2.32%
$114.58
Philharmonic
2.66%
$133.23
Britannia
3.11%
$148.17
Maple Leaf
3.20%
$156.50
Random-year 1 oz gold, 24 February–31 March 2026, median across the window. Krugerrand level holds. The other three levels move with the timing of spot.
The premium rose as the metal fell
Gold's percentage premium rose in every way it was measured, because dollar markups fell only part of the way. March 2026, inside this selloff, is the highest gold percentage month of the fifteen, at 5.21%.
Month
Spot
Premium
Markup
Observations
2026-02
$5,030.24
4.36% †
$219.30
6,502
2026-03
$4,840.67
5.21% ‡
$249.88 ‡
9,176
2026-04
$4,719.23
4.52%
$213.12 †
9,209
† Minimum of that column. ‡ Maximum of that column. Premium: 2026-02 / 2026-03. Markup: 2026-04 / 2026-03.
For buyers: the selloff lowered the price of the metal faster than the premium, and the random-year Krugerrand remained the cheapest 1 oz gold coin.
II.8 — Through four months of decline, the Krugerrand was cheapest in all 18 weeks (April – July 2026)
Through four months of steady decline, the random-year Krugerrand was the cheapest 1 oz gold coin in every one of 18 weeks. The count is identical under every way of timing spot tested, and there is no week in the published ranking in which another coin takes the top slot.
The window runs 1 April through 30 July 2026, ranked by week. Eighteen weeks had all four coins, and the Krugerrand was present in all 18.
Month
Spot
Premium
Markup
Observations
2026-04
$4,719.23
4.52%
$213.12 ‡
9,209
2026-05
$4,584.20
4.46% †
$204.23
12,557
2026-06
$4,171.89
5.04% ‡
$212.12
7,003
2026-07
$4,072.78
4.95%
$201.68 †
10,863
† Minimum of that column. ‡ Maximum of that column. Premium: 2026-05 / 2026-06. Markup: 2026-07 / 2026-04.
1 oz coins from the major bullion programs, plus bars. April–July 2026.
The gold premium rose through the decline, while the Krugerrand followed spot more closely. The percentage premium rose in every way this decline was measured. Dollar markups did not fall one-for-one with the metal, and in some readings they rose. The Krugerrand, still cheapest every week, tracked spot down more fully than the basket.
For buyers: in a long decline, the premium took a larger share of the price, and the random-year Krugerrand stayed the cheapest choice every week.
II.9 — Silver Eagle buyers who waited out the spike paid more premium, not less (June 2025 – August 2026)
The best-selling silver coin in the U.S. shows II.1's decline finding on a single product. The American Silver Eagle's percentage premium hit its fifteen-month low in January 2026, as silver spot spiked. Over the next two months spot fell while the dollar markup rose. The buyer who waited for the spike to pass paid more premium per coin, not less.
The series is 1 oz Silver Eagles in bullion condition, of any date, as monthly medians from June 2025 through August 2026.
Month
Spot
Premium
Markup
Observations
2025-06
$35.98
28.42%
$10.23 †
3,287
2025-07
$37.74
27.65%
$10.42
7,212
2025-08
$38.12
27.75%
$10.72
7,489
2025-09
$43.06
24.61%
$10.75
4,398
2025-10
$49.48
24.67%
$12.11
4,876
2025-11
$54.26
25.76%
$13.23
975
2025-12
$63.12
23.99%
$15.53
2,927
2026-01
$84.37
22.97% †
$18.97
1,877
2026-02
$83.07
26.75%
$22.00
2,782
2026-03
$77.60
29.94%
$23.26 ‡
4,678
2026-04
$75.67
29.25%
$22.23
3,752
2026-05
$77.64
28.09%
$21.80
4,277
2026-06
$63.79
33.21%
$21.24
2,456
2026-07
$58.66
35.48% ‡
$20.61
3,051
2026-08
$65.70
30.47%
$20.21
3,089
† Minimum of that column. ‡ Maximum of that column. Premium: 2026-01 / 2026-07. Markup: 2025-06 / 2026-03.
Measure
Month
Level
Percentage premium (minimum)
January 2026
22.97%
Percentage premium, next-lowest
December 2025
23.99%
Percentage premium (maximum)
July 2026
35.48%
Dollar markup (minimum)
June 2025
$10.23
Dollar markup (maximum, one timing)
March 2026
$23.26
1 oz Silver Eagles in bullion condition, of any date. June 2025–August 2026. January is about one point below December (1.03 percentage points).
January's 22.97% is a fact about this coin in this month, not a rally-wide pattern for silver or for gold.
Four extremes, four different months
The Eagle's cheapest and dearest months depend on which measure a buyer reads.
Measure
Cheapest month
Level
Dearest month
Level
Percentage premium
January 2026
22.97%
July 2026
35.48%
Dollar markup
June 2025
$10.23
March 2026
$23.26
Same series. March is the dearest dollar month on one timing only; under one of the other ways of timing spot, February's markup is the higher of the two. Naming either as the maximum would depend on the clock, so the peak is February–March.
Both readings are accurate; they describe different things. On percentage, January was the cheap month to buy an Eagle and July the expensive one. On dollars, June 2025 was the cheap month and late winter 2026 the expensive one. The percentage hit its low because spot had run ahead of the shelf price. The dollars hit their high after spot had already turned down, because the shelf price had not given the gain back.
January to March: markup up, spot down
From January to March 2026, the Eagle's markup rose from $18.97 to $23.26 while spot fell from $84.37 to $77.60. The comparison is the January month against the March month, not one day against another. The direction holds under the other ways of timing spot: $19.71 to $22.71 against spot of $84.28 to $78.30 on one timing, and $19.71 to $22.75 on the other.
The buyer who waited out January and bought in March paid a larger dollar premium on the coin. The percentage was higher too, which is what a lag looks like once spot has fallen and the posted price has not given the gain back. February sits inside that path: the climb in the dollar premium is already underway, which is why the peak is named as February–March.
This is II.1's decline finding on one coin. On the later, longer decline, the Eagle's markup passed through 25–34% of the fall, in line with the silver-coin series.
The full fifteen months
Across the whole window, the Eagle's dollar markup went from $10.23 to $20.21, up $9.98 — about $10 a coin. That is what the fifteen months did; the January-to-March lag is what the spike did inside them. About 21.8 cents of every dollar spent on this series was premium rather than metal, a buyer-cost share that holds under the other ways of timing spot.
The mix of 2025-dated, back-dated and random-year Eagles shifts over the window. Excluding 2025-dated coins does not change the result (see M.8).
What this means for buyers
Treat a percentage low during a spike as a description of the spike, not as a sale. On the Eagle, the dollar markup was higher in March than in January, after spot had turned down.
Judge an Eagle purchase in dollars. The monthly extremes, the four months they fall in, and the January-to-March path all point the same way: the markup lags spot on the way down.
What this report can't tell you
Every dataset has edges. These are this one's, with what each means for the findings.
The products are the ones dealers listed in June–July 2025. The set of tracked products was fixed then; no month since added more than ten. Coins dated 2026 were not tracked. Findings about 2025-dated coins cover all fifteen months, including 2026 months when a 2025 coin was the previous year's issue. Products that dealers added later — new designs, new bars — are not in any figure. A future edition with a growing catalogue will cover them.
Availability is not measured in this edition. Because the product set was fixed, some tracked listings age out of stock for reasons unrelated to the market. In-stock rates over time would mix the two, so this edition does not publish them. Where a dealer's stock matters to a finding, as with BullionExchanges in gold, it is stated for that finding.
Prices are check/wire, for a single unit. Card payment usually costs more. Volume pricing — the lower per-coin price for larger orders — is not observed. This makes the singles in the pack comparison the highest per-coin price, which strengthens that finding, and it means volume buyers may pay less than the premiums shown.
Prices were captured at different times of day before February 2026. Until February 2026, most dealers other than Apmex were captured in the afternoon (UTC); from February, nearly all were captured overnight. One dealer's June–November 2025 records carry dates rather than times of capture; they are treated as captured at midnight UTC, the hour at which that dealer's prices were captured in every later month. Every premium is measured against the midpoint of that day's reference price. Comparisons across dealers use only dealers captured in the same part of the same day, and the report's central finding was re-checked with timing held constant (see M.3). Matching each price to the reference price at its exact time of capture is planned for the next edition.
Coverage differs by dealer. Some dealers have many days with no data: Money Metals Exchange 267, SilverGoldBull 239, BullionExchanges 165 and Kitco 136, against 88–121 for the rest. Money Metals Exchange's prices enter the daily data only from February 12, 2026. A dealer needs 20 comparable days on a coin to be ranked on it; others are listed as insufficient data.
One dealer is not ranked. Golden State Mint's listings were reported in stock almost without exception, which could not be verified, so it is left out of the dealer comparisons (see III.9).
Some bars are hard to classify. Collectible bars — art, themed, vintage — carry premiums unrelated to the metal. The filter used to set them aside also caught many ordinary bars, so every bar figure is published as a range with and without it. Each finding points the same way either way. The next edition will use a narrower filter.
Some products could not be measured. Fractional silver coins, silver bars under one ounce, gold rounds, junk-silver lot sizes, 40% halves and war nickels had too few dealers selling both sides of a comparison in the same months. Products whose listed name and stored weight disagreed are left out of the size comparisons.
Five sovereign programs are outside the major-program series: the Kookaburra, the Australian Lunar, the Koala, the gold Lunar and the British Lunar issues. Their premiums are not in the market series or the coin rankings.
Figures are medians, and some are ranges. A median is the middle dealer's or the middle day's value, not an average. Where a reasonable choice of method — how many listings a dealer-month needs, which bars count as collectible — moves a figure by more than the report's tolerance, the figure is shown as a range covering both. Where fewer than three dealers support a figure, it is a range or is not published.
This is a record of prices, not of causes. Where the report offers a reason for a pattern, it says so and labels it an interpretation.
How we measured
M.0 — Opening
This section says what was measured and what could make a number wrong. It sits here as a reference, so any figure above can be checked against the method that produced it. Every figure in this report traces to documented queries and a claims register. Errors are corrected in public.
M.1 — What was tracked
The window is 1 June 2025 through 31 August 2026. The last usable day for gold and for silver is 27 August 2026. The later August dates are stub days in the reference feed.
The panel holds 4,249,882 observations across 12,142 products, 11 dealers and 377 observation days. Gold and silver in stock account for 1,278,454 of those observations, on 8,054 products.
One observation is one listed ask price for one product at one dealer at one capture. Premium figures cover in-stock listings only. This is the ask side only; there is no data on what dealers pay when they buy metal back (see "What this report can't tell you").
All prices come from one third-party scraping provider. June 2 to early November 2025 was loaded from the provider's historical records; later months arrived in the provider's daily deliveries. The switch to daily delivery was 6 November 2025 for most dealers, 25–26 November for Golden State Mint, SilverGoldBull and Kitco, and 12 February 2026 for Money Metals Exchange. Dealer premium levels show no break at the switch, checked against the other dealers over the same dates.
The products tracked are the ones dealers listed in June–July 2025; no month since has added more than ten. Coins dated 2026 were not tracked. Availability over time is therefore not measured in this edition: listings in a fixed product set age out of stock for reasons unrelated to the market (see "What this report can't tell you").
The eleven dealers are Apmex, BGASC, BullionExchanges, Golden State Mint, Hero Bullion, JM Bullion, Kitco, Money Metals Exchange, Provident Metals, SD Bullion and SilverGoldBull. Coverage is not the same at every dealer. Per-dealer counts, and the days each dealer has no data, are in the coverage table (see "Dealer coverage" under "How we measured").
M.2 — Spot, premium and markup
Spot is the reference price from an independent daily feed, Metals-API (metals-api.com). It is not the spot price each dealer displays. Premiums are measured against the midpoint of each day's high and low. The midpoint is a daily figure, not matched to each price's capture time, because structural differences between dealer spot feeds were larger than scrape-timing variance. This edition measured what that choice costs on volatile days; that cost is what M.3 reports.
Using reference spot rather than dealer spot matters most for dealer comparisons. Dealer spot feeds differ by provider, bid/ask convention and parsing errors. In a sample of 24 days, the dealer with the lowest premium changed between the two spot measures on 7 Silver Eagle days and 3 Gold Eagle days.
Premium is the price above the metal's value, as a percentage of the metal's value. Markup is the same gap in dollars.
Every price is the dealer's check/wire price — or its bank-transfer equivalent — for the smallest quantity it sells, usually a single coin or bar. That is normally a dealer's lowest payment price and its highest price per unit. Buyers paying by card typically pay more; buyers of larger quantities may pay less.
The report uses dollars to follow one product through time. Percentages move when spot moves, even if the dealer does not change the shelf price. The report uses percentages to compare products, or metals, at the same moment. Cross-metal comparisons are per dollar of metal, not per ounce.
Pass-through is the share of a change in spot that shows up in the dollar markup: the change in markup divided by the change in spot, for a one-ounce product. Pass-through and the change in percentage premium are two views of the same movement; the report uses pass-through because it reads naturally in dollars.
Monthly spot figures in the tables are the listing-weighted mean of that midpoint. Each in-stock listing in the month contributes its day's reference midpoint equally.
The stored premium is ((price − spot × weight) / (spot × weight)) × 100. Publication tables round to two decimals.
M.3 — Spot timing
Premiums are measured against the midpoint of the day's spot range. Across the window, 52.98% of gold listings and 51.60% of silver listings were captured at hour 0 UTC, and paired with that day's midpoint before much of the trading day had happened. On days when spot moves sharply, this understates premiums in rallies and overstates them in selloffs, by roughly one to two percentage points. On the strongest up days the understatement is about 1.0 point for gold and about 1.8 for silver.
Capture times changed during the window. Before February 2026, most dealers other than Apmex were captured between 12:00 and 17:00 UTC; from February 2026, nearly all were captured between 00:00 and 05:59 UTC. The share of gold listings captured in that early-morning band was 51.09% in the historical-load period and 85.53% after the switch to daily delivery; for silver, 44.19% and 87.40%. Apmex was captured at hour 0 throughout. Its June–November 2025 records carry dates rather than capture times and are treated as captured at 00:00 UTC.
Every figure was re-run under two other timings, for prices captured between midnight and 06:00 UTC: the day's opening price, and the previous day's close. That early-morning band is 70.64% of gold listings and 63.46% of silver listings. Later captures keep the midpoint. The set of listings is held fixed. Only the spot value changes.
What holds: every ranking leader — the coin cheapest on the most days — is the same under all three timings, and so are the report's central findings.
Because the change in capture time coincided with the turn from rally to decline, the central finding was also re-run with timing held constant: on Apmex alone, against the day's opening price, and on early-morning captures only, against the day's opening price, with at least three dealers. Markups followed spot up and lagged it down on both. The buyer's guide's dealer comparisons avoid the issue by design: dealers are compared only with dealers captured in the same part of the same day (M.10).
What moves: individual days. The cheapest coin changes on four gold days and two silver days under the other timings. That is why day counts are published as ranges ("23–25 of 28 days"). Silver levels that move more than half a point are published to one decimal and marked.
Readers who compare the report's spot with their dealer's screen will see a gap. The median gap between the reference midpoint and the spot dealers displayed was −0.38% for gold and −0.66% for silver, the reference sitting below dealer spot. A likely reason is that dealers generally display the ask side of spot, and the reference midpoint sits between bid and ask. The gap is in the data. The cause is not.
The next edition will match spot to the time each price was captured.
M.4 — What counts as bullion
Bullion is defined by inclusion: 1 oz coins from 19 named catalog categories, plus rounds and bars.
Gold: American Buffalo, American Eagle, Britannia, Kangaroo, Krugerrand, Libertad, Maple Leaf, Panda, Philharmonic. Silver: American Eagle, Britannia, Kangaroo, Krugerrand, Libertad, Maple Leaf, Panda, Philharmonic. Krugerrand gold is pooled across three catalog entries.
Inclusion replaced exclusion because lists of things to leave out kept letting novelty and collector coins through. Their share moved over time: novelty 1 oz coins sat in the silver market series at 4–6% of observations in mid-2025 and under 2% later.
What is left out, and why:
graded, slabbed, proof and burnished coins, and collector pieces sold with certificates;
coins described as cleaned, damaged or otherwise impaired;
privy-marked and themed editions of bullion coins — 28 named products, plus any listing with "privy" in the name;
five sovereign programs: Kookaburra, Australian Lunar, Koala, gold Lunar and British Lunar.
Those five programs are real bullion. They fall outside the report's defined set of 19 categories. Their premiums are therefore not reflected in the major-program series. It is listed as a limitation (see "What this report can't tell you").
The 1 oz basket is 0.95–1.05 troy ounces. Pandas sit in that band at their 30 g catalog weight.
The effect of these rules on population size is in the register (gold 158,705 → 135,291; silver coins 145,002 → 99,189) and in M.12.
M.5 — Dates and segments
Every coin is placed in exactly one segment: random-year, dated 2024 or earlier, dated 2025, undated, graded/proof/burnished, or multi-dated bullion. No coins dated 2026 were in the tracked product set, so "dated 2025" is the most recent issue observed. Multi-dated bullion is bullion that is not random-year and has no single year, because its name or year field holds a range (for example "1979–1982 dates"). Across the 19 categories that segment is 5 products and 871 observations, of which 639 sit in the gold major-programs series and none in the Silver Eagle or silver-coin series. The year comes from the product's year field when it holds a clean four-digit year, otherwise from the product name.
A missing year is not read as random-year. Many products with no recorded year are dated coins, so a listing counts as random-year only when its name or year field says so.
The CASE used in this edition places every 1 oz bullion observation in exactly one segment (residual 0 on 373,209 observations). Graded coins also have years, and random-year coins can also read as undated, so the tests overlap if they are run independently. The CASE still partitions.
The bullion/graded gate on the 19 categories also closed: overlap 0, gap 0, at product level and at observation level.
M.6 — Days and prices set aside
Days are judged on how far the reference price sits from what dealers were quoting, not on how volatile the day was, so genuine crash days stay in.
Always excluded: days where the reference feed was corrupt, missing, or showed provider-interpolated values. Gold: 4 days, 28–31 August 2026, all stub rows. Silver: 16 days — 23 October 2025 corrupt; interpolation on 2–4 October 2025, 1–3 July 2026 and 21–25 July 2026; and the same August stubs.
Excluded from monthly levels, kept for same-day rankings: two silver days in the squeeze, 31 January and 5 February 2026, where the reference price and dealer quotes were more than 10% apart. Rankings can keep them because every coin on the same day shares the same spot.
Kept: US market holidays with a flat feed, and the silver crash day of 30 January 2026.
The premium bound is 0% to 300% throughout. Below zero means a listing's weight is recorded wrongly. The 300% cap guards against data errors; it is not a market filter. The ranking panels were computed at 0–100%; none of their observations fall between 100% and 300%, so their results are identical under either bound. A 0–100% bound would have removed more silver in mid-2025 than in 2026, because a fixed dollar markup crosses 100% only when spot is low, and that would have bent the trend.
M.7 — Measuring change
Every change is measured two ways: first month against last, and the first three months averaged against the last three. Where they disagree, the report says so. Gold's full-window premium is the example: +0.06 against +0.46 points.
A change is treated as real at 0.15 points for gold, 0.50 for silver, or 3% of the dollar markup. Directions, rankings and extreme months must hold exactly.
Peak-selected endpoints are not used as headlines. Daily event windows are published as pooled levels and rankings, not as a change from one day to another.
Verdicts:
Robust — holds under every variant tested.
Robust, with the level disclosed — direction holds; the level moves beyond tolerance under a variant.
Fragile — direction, rank or extreme month depends on the variant.
Withdrawn — does not hold on the publication basis.
A figure describes a market only if at least three dealers contribute and none supplies more than half the listings. The number of products is not a test, because one random-year product is typically listed by many dealers.
Medians throughout.
M.8 — Product mix
In-stock filtering shows only what has not sold out. In a squeeze, clean coins sell first and heavier bars and impaired coins remain, so a basket can change price without any dealer changing a price.
The report's central evidence therefore uses fixed-size, fixed-program series. Baskets are context. Monthly shares by program and by form are checked, and any share moving more than 5 points is flagged. The silver-coin series is the example: the Silver Eagle's share of that series moves between 53.20% and 64.86%.
The silver decline result is confirmed on the Silver Eagle alone.
Coins dated 2025 fall from about 22% of the Silver Eagle series in mid-2025 to about 8% by August 2026; coins dated 2026 were not tracked. With them removed, every Silver Eagle claim in II.9 holds under all three spot timings: January 2026 remains the percentage minimum, July 2026 the maximum, June 2025 the dollar-markup minimum, the markup peak falls in February–March, the markup still rises from January to March while spot falls, and the four extremes still fall in four different months.
M.9 — Dealer figures and affiliate relationships
As of publication, BullionMetric has no affiliate or commercial relationship with any dealer named in this report, and no dealer has seen or commented on these findings. The disclosure is stated once, dated, at the top of the report and at the start of the dealer section. If relationships begin, they will be listed there with their start dates; findings are not revised because a relationship begins.
Every qualifying dealer is reported. None is left out or reordered for any reason except the stated threshold. Unflattering results are published on the same terms as any other, whatever a dealer's relationship with BullionMetric.
Year premiums are measured within each dealer and then summarized across dealers, so a dealer's catalogue cannot pass for a price difference. In the quiet-summer window (II.2): at least 10 listings on each side; three or more paired dealers for a point figure; two dealers give a range only. The buyer's guide's full-window method is in M.10.
Where the spread between dealers is wider than the figure itself, the spread is the finding.
M.10 — How the buyer's guide compares products and dealers
The buyer's guide compares one choice with another: a dated coin against the random-year version, a tenth-ounce coin against an ounce, a bar against a coin, one dealer against another. Over fifteen months the two sides of such a comparison were rarely in stock at the same times, and premiums moved a great deal. A comparison pooled over the whole window would partly measure when each product happened to be listed.
Same dealer, same month. Every product comparison in the buyer's guide is made within one dealer and one calendar month, then combined. A dealer-month counts when both sides have at least five listings. A dealer needs three such months (two for a single year of one coin), and its value is the median of its months. The published figure is the median across dealers: three or more dealers give a single estimate with the dealers' range; two give a range only; fewer, no figure. Every figure was re-run requiring ten listings a side; where that moves it beyond tolerance, the figure is published as a range covering both. Months pair like with like; no monthly figure is published.
Each dealer counts once in these medians, however many months it contributes, so a dealer supplying more than half the months is disclosed, not excluded. Pooled levels keep the M.7 rule: at least three dealers, none above half the listings.
Units. Date, graded and year differences lead with dollars, because they are what a buyer pays for the same coin. Size and form differences lead with percentage points, then dollars per troy ounce of metal, so a tenth-ounce coin and a kilo bar can be set side by side. Dollar differences per item between sizes are not used: a smaller coin naturally carries a smaller dollar markup.
Coin rankings are built month by month. Coins that swap places between ranking methods are grouped in tiers, not numbered.
Dealers are compared on the same day, in the same part of the day. The dealer comparison uses the 1 oz random-year coin of each program, the one product that is the same at every dealer. A day counts when at least three dealers had the coin in stock and were captured in the same part of the day (00:00–05:59, 06:00–11:59, 12:00–17:59 or 18:00–23:59 UTC); dealers are compared only within that part. A dealer needs 20 such days on a coin to be ranked on it. Results are computed for June 2025 – January 2026 and February – August 2026 separately; a dealer leads a coin only if it leads in both, unless stated otherwise. Savings from comparing are the median gap between the middle dealer and the cheapest on each day, over the full window.
Golden State Mint is left out of the dealer comparisons. Its listings were reported in stock almost without exception, which could not be verified, and a dealer shown as cheapest must be one a buyer can buy from.
Sizes are read from each product's stored weight. Products whose name states a different size are left out of size comparisons. The Panda's 15 g coin is compared as a half ounce, at its actual weight.
Collectible bars. Bars sold as collectibles — art designs, themed series, vintage pours — carry premiums unrelated to the metal. The filter used to set them aside also catches many ordinary bars, so every bar figure is published as a range, with and without it.
Junk silver is priced on its silver content: 0.715 troy ounces per dollar of face value for 90% silver coin, and 0.7734 ounces per silver dollar. Graded, proof, uncirculated and key-date dollars are excluded.
Labels. "Dated" in the buyer's guide means coins dated 2024 or earlier. Coins dated 2025 are reported separately, across all fifteen months. No coins dated 2026 were tracked.
M.11 — Outside facts
Market events named in the report — policy decisions, the rate cut, the scale of the silver spike and the gold selloff — come from named outside sources, attributed where they appear. BullionMetric's price data is used only for what dealers charged. Where the report suggests why prices moved, it says so as interpretation. No outside source is named here; each is named at its point of use.
M.12 — Rules at a glance
Rule
What it does
Effect
Base window and in-stock
1 June 2025 through 31 August 2026; listings in stock
4,249,882 observations, all metals, all stock; 1,278,454 gold and silver in stock
Metal
Gold and silver only
—
Bullion (grading and proof)
Drops graded, proof, burnished, certified and named collector pieces
1 oz basket 610,222 → 1 oz bullion 373,209
Condition
Drops cleaned, damaged and similar name markers
—
Random-year
A random-year signal in the name or year field
—
Effective year
Year field if a clean four-digit year; otherwise the name
—
Date segment
One of random-year, dated 2024 or earlier, dated 2025, multi-dated bullion, undated, graded/proof/burnished
Each of the 373,209 1 oz bullion observations falls in exactly one segment
0.15 points gold, 0.50 silver, 3% of dollar markup
Directions, rankings, extreme months must hold exactly
Mix flag
Share moving more than 5 points
Silver Eagle share of silver coins, major programs 53.20–64.86 points
Month-matched comparison (buyer's guide)
Within dealer and calendar month; at least 5 listings a side; at least 3 months per dealer (2 for a single year); median across dealers
Every buyer's-guide tax. Re-run at 10 listings a side; ranges where it moves beyond tolerance
Adequacy for comparisons
Each dealer counts once; concentration disclosed, not disqualifying
Pooled levels keep the three-dealer, half-the-listings rule
Same-time comparison
Comparisons over more than one month pair observations within the month or day
Coin rankings shown as tiers where methods disagree
Dealer comparison
1 oz random-year coins; same UTC day and capture period; at least 3 dealers; at least 20 comparable days per dealer and coin; two periods
See III.9
Golden State Mint
Left out of dealer comparisons
Stock status could not be verified
Collectible bars
Published as a range with and without the collectible filter
Every bar finding points the same way under both
Junk silver
Premium on silver content: 0.715 oz per $1 face (90%); 0.7734 oz per silver dollar
Graded, proof, uncirculated and key-date dollars excluded
Sizes
Nominal size from stored weight; name–weight conflicts left out of size comparisons
See III.6
Capture periods
Two regimes: before and from February 2026
Central finding re-checked with timing held constant
Glossary
Spot: the reference price of the metal, from an independent daily feed; the report uses the midpoint of each day's range.
Premium: the price paid above spot, as a percentage of spot.
Markup: the same gap in dollars.
Pass-through: the change in the dollar markup as a share of the change in the metal's price over a window.
Random-year: a coin sold without a specified year; the dealer chooses which.
Dated: a coin of a specified year. In the buyer's guide, "dated" means 2024 or earlier; 2025-dated coins are reported separately.
Date tax: how much more a dealer charges for a dated coin than for the same coin random-year, in the same month.
Slab tax: the same comparison for a graded or proof coin.
Junk silver: circulated U.S. coins with silver content, priced on the silver they contain.
Comparable day: a day on which at least three dealers had the same random-year coin in stock and were captured in the same part of the day.
Range only: a figure supported by two dealers, shown as the range between them.
Coin programs
The 17 coin programs measured, by metal:
Gold: American Buffalo, American Eagle, Britannia, Kangaroo, Krugerrand, Libertad, Maple Leaf, Panda, Philharmonic.
Silver: American Eagle, Britannia, Kangaroo, Krugerrand, Libertad, Maple Leaf, Panda, Philharmonic.
Dealers
Apmex, BGASC, BullionExchanges, Golden State Mint, Hero Bullion, JM Bullion, Kitco, Money Metals Exchange, Provident Metals, SD Bullion and SilverGoldBull.
Dealer coverage
Dealer
Observations
First day
Last day
Days without data
Apmex
1,946,807
2025-06-04
2026-08-31
101
BGASC
186,223
2025-06-02
2026-07-29
88
BullionExchanges
438,839
2025-06-04
2026-08-31
165
Golden State Mint
4,332
2025-06-02
2026-08-31
95
Hero Bullion
209,465
2025-06-02
2026-08-31
111
JM Bullion
542,872
2025-06-14
2026-08-31
121
Kitco
15,599
2025-06-04
2026-08-31
136
Money Metals Exchange
87,641
2025-06-02
2026-08-31
267
Provident Metals
484,671
2025-06-02
2026-08-31
98
SD Bullion
210,187
2025-06-02
2026-08-31
103
SilverGoldBull
123,246
2025-06-17
2026-08-31
239
All metals and stock statuses, 1 June 2025 – 31 August 2026. Days without data are counted between each dealer's first and last day. Money Metals Exchange's prices enter the daily data from 12 February 2026.
Data and reproducibility
Every figure in this report traces to a row in its claims registers, and each row names the query that produced it. The methodology describes every filter and threshold. Corrections are made in public.
Sources
Market context sources
These four passages are outside facts, not BullionMetric data. Each is stated only as far as its sources support.
Section
Fact
Sources
II.4
USGS final 2025 List of Critical Minerals released November 6, 2025, adding ten minerals including silver; gold not listed
Silver record near $121 on January 29, 2026; ~30% fall on January 30, worst session since 1980; widely attributed to the Warsh nomination and CME margin increases
The US Mint introduced a new reverse design for the American Silver Eagle in mid-2021; the last coins with the original design and the first with the new design were struck in April 2021
Note on II.7: some outlets measured March 2026 as gold's worst month since 2008, using different price series and start dates. The report uses the World Gold Council's figure and attributes it.
State of Retail Bullion Premiums 2026 | BullionMetric